AOSP Hybrid RBE System Load Sweet-Spot Study
Empirical determination of optimal Ninja -l / user_load_average limits from live cgroup v2, PSI, and build progress telemetry.
🎛️ Interactive Load Regime Explorer & What-If Simulator
Slide across 25-unit empirical load bins (112 to 738) to inspect real measured host throughput, per-build velocity, CPU core saturation, and stall rates.
⚙️ First-Principles Mechanics: 70% Remote RBE / 30–40% Local Workload
In production /opt/ninja (src/build.cc:262), max_load_average (-l or Redis user_load_average:<user>) only gates new local-pool jobs when GetLoadAverage() >= max_load_average. Ready remote RBE edges (remote_pool / default pool) and critical-path local code generators continue launching unimpeded.
Why 440.0 is the Physical Sweet Spot
- Full Physical Core Saturation: User build slices consume 115–127 mean vCPUs (161–165 P90 vCPUs), leaving ~28 vCPUs for host
reproxyCAS hashing, gRPC streams, and kernel I/O on the 192-thread server. - Healthy 3.4x–3.6x Load Multiplier: With ~1,000 in-flight remote
rewrapperprocesses and ~300–400 local compilation/linking threads across 4–5 concurrent builds, 125 active cores naturally generate a Linux load average of 420–460. - Retrograde Cliff Above 480: Past load 480, active CPU cores drop from 126.8 down to 85–102 cores while
Load / Active Coreexplodes from 3.6x to 8.5x, starvingreproxyand collapsing RBE compile throughput by 89%.
Recommended Tiered Configuration (resource_controller.py)
# models/build_monitor_components/resource_controller.py:325
# Replaces {"standard": 700.0, "upper_mid": 650.0, "mid": 600.0, "low": 550.0}
tier_load_map = {
    "standard": 460.0,   # Priority SLA: top sweet-spot knee
    "upper_mid": 430.0,  # Standard SLA: yields before Priority
    "mid": 400.0,        # Flex SLA: yields at physical saturation
    "low": 360.0,        # Starter SLA: opportunistic local slots
}
📈 High-Resolution Empirical Telemetry Charts (n = 111,880 Snapshots)
Figure 1: Total Server Build Throughput & Per-Build Stall Rate vs. System Load
25-unit granular resolution across 23,224 active 8-second compilation windows. Shows peak contended server capacity at load 300–450 (~305–312 actions/sec), minimum stall rate at 350–450 (4.0%–4.5%), and the severe stall cliff above 480.
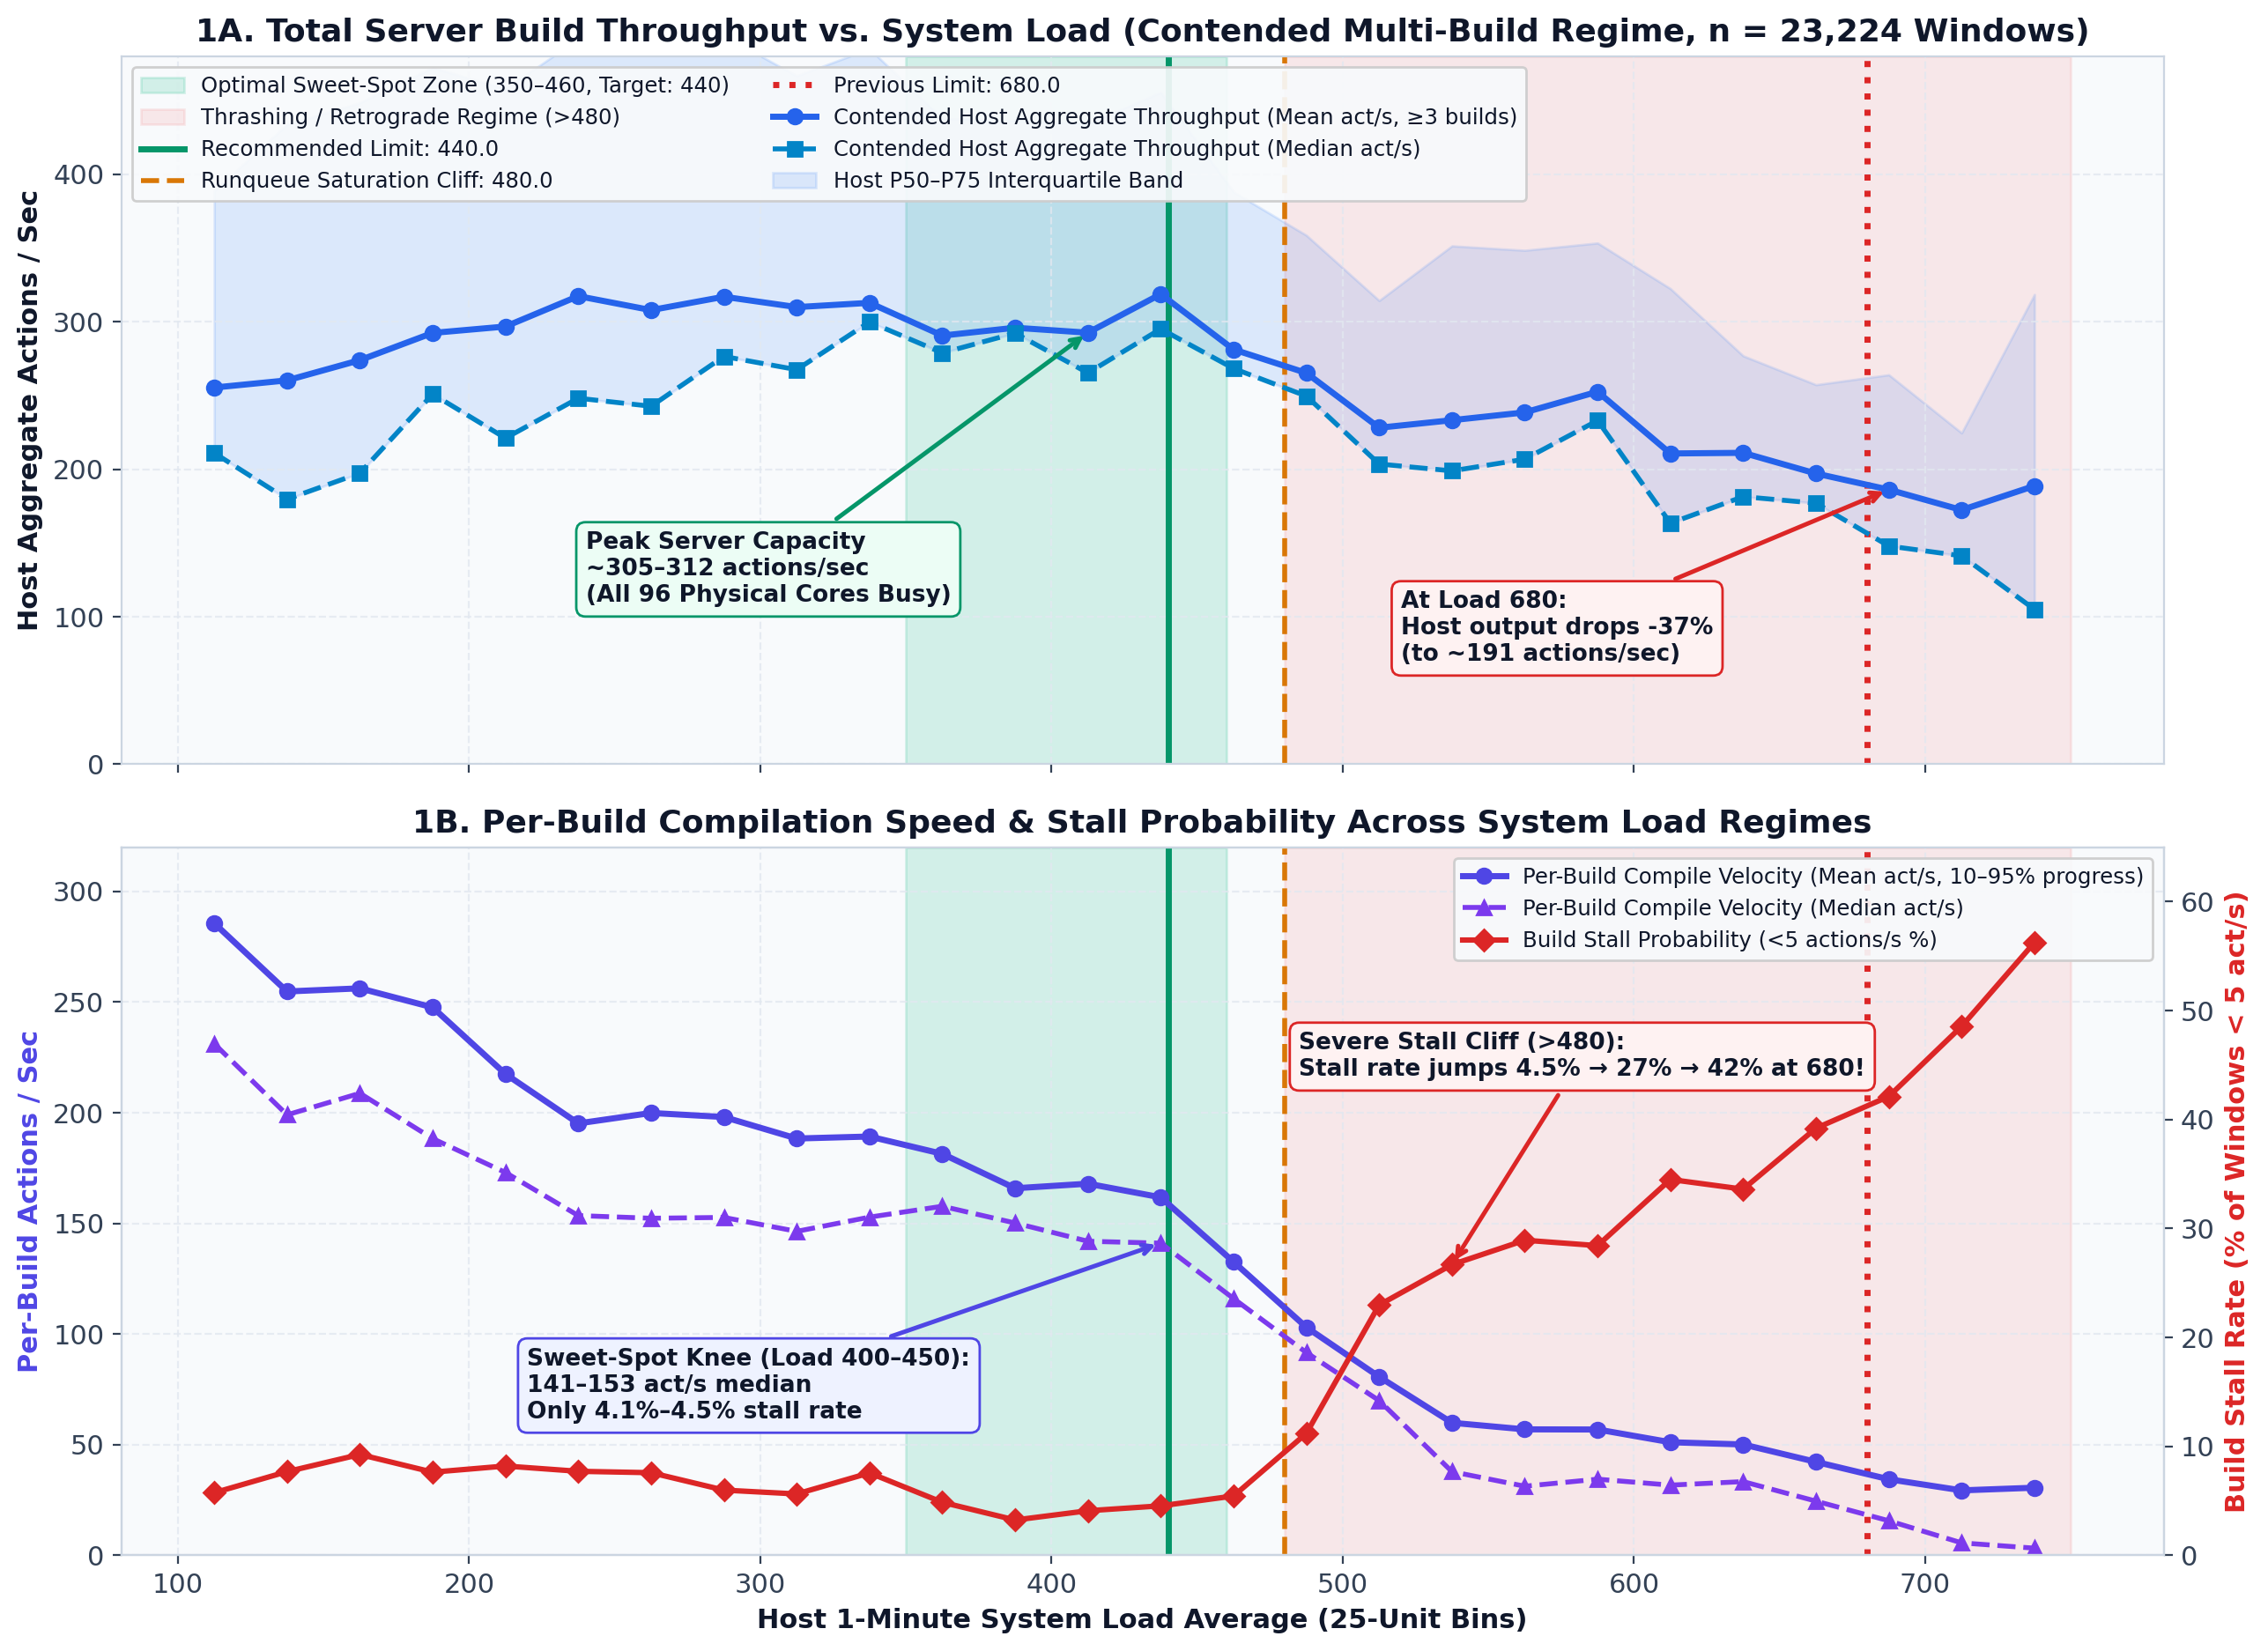
Figure 2: Build Action Velocity Stratified by Execution Phase (Full AOSP Builds ≥ 100k Actions)
Separates Phase 1 (10–75%: 70% RBE Remote Compile), Phase 2 (75–95%: Mixed Link / Rust / Metalava / R8), and Phase 3 (95–99.8%: Local Packaging). Phase 2 peaks at load 350–450 (122–131 act/s) before all three phases collapse past 480.
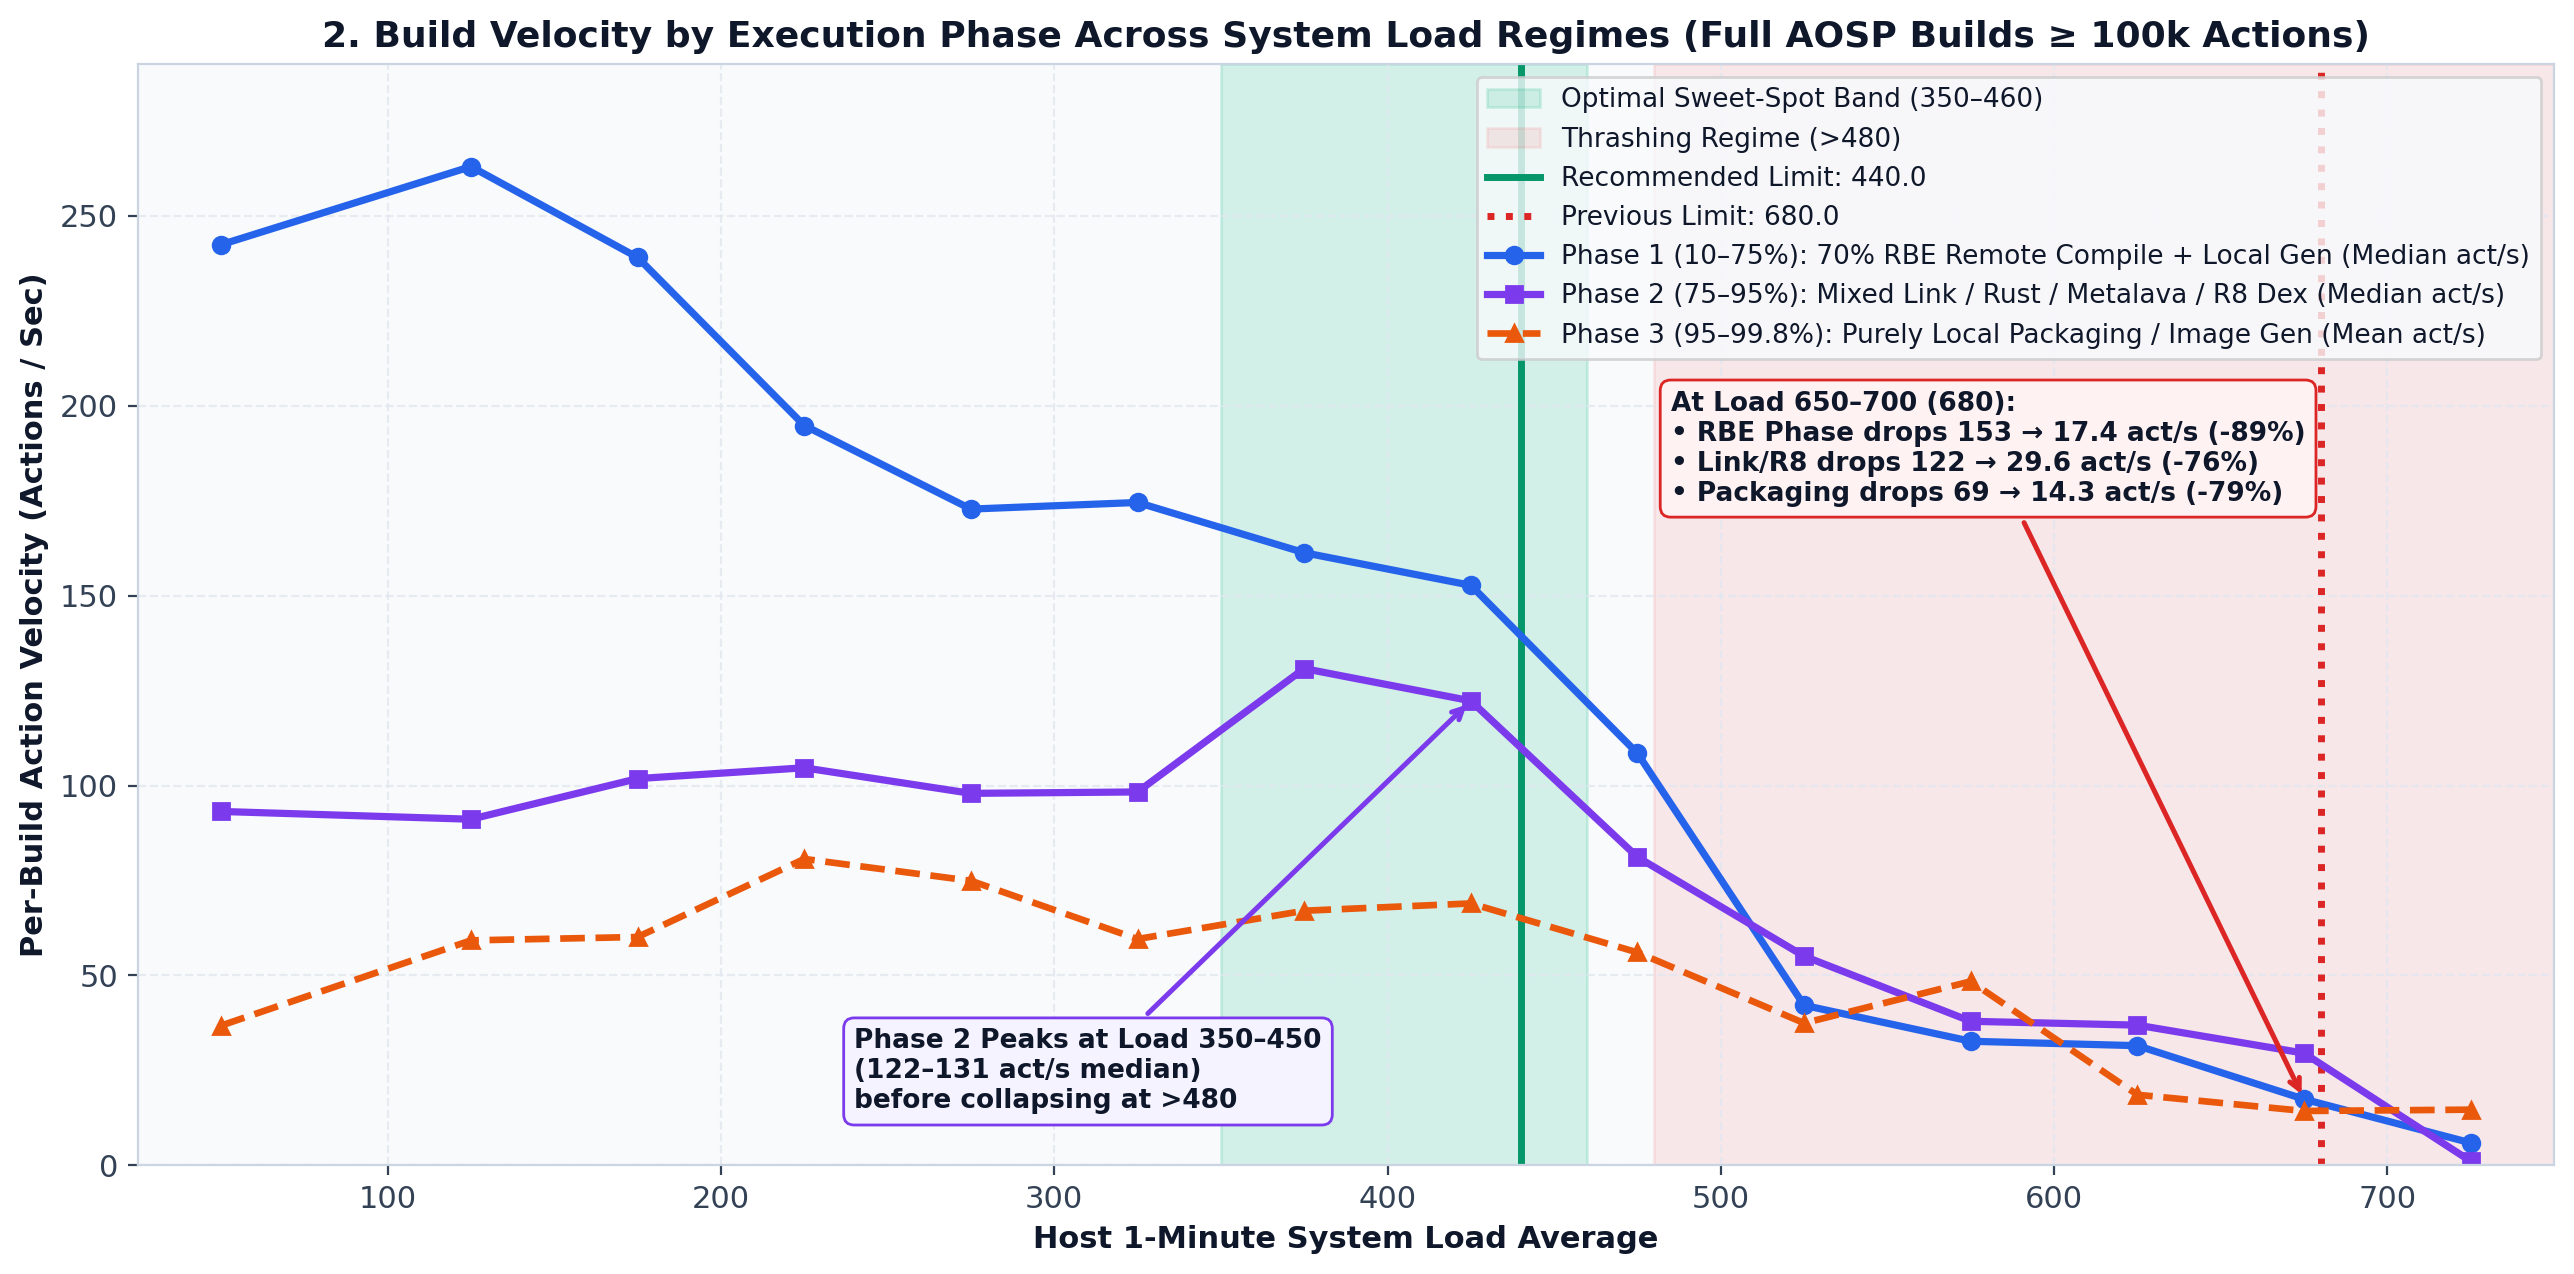
Figure 3: Host CPU Core Utilization vs. Runqueue Inflation Ratio (Load / Active Core)
Demonstrates why load > 480 is retrograde: actual CPU cores utilized by user slices peak at 115–127 mean cores (163–165 P90 cores) at load 350–460, then fall to 85 cores at load 680 as threads pile up in uninterruptible sleep (D-state) and memory PSI.
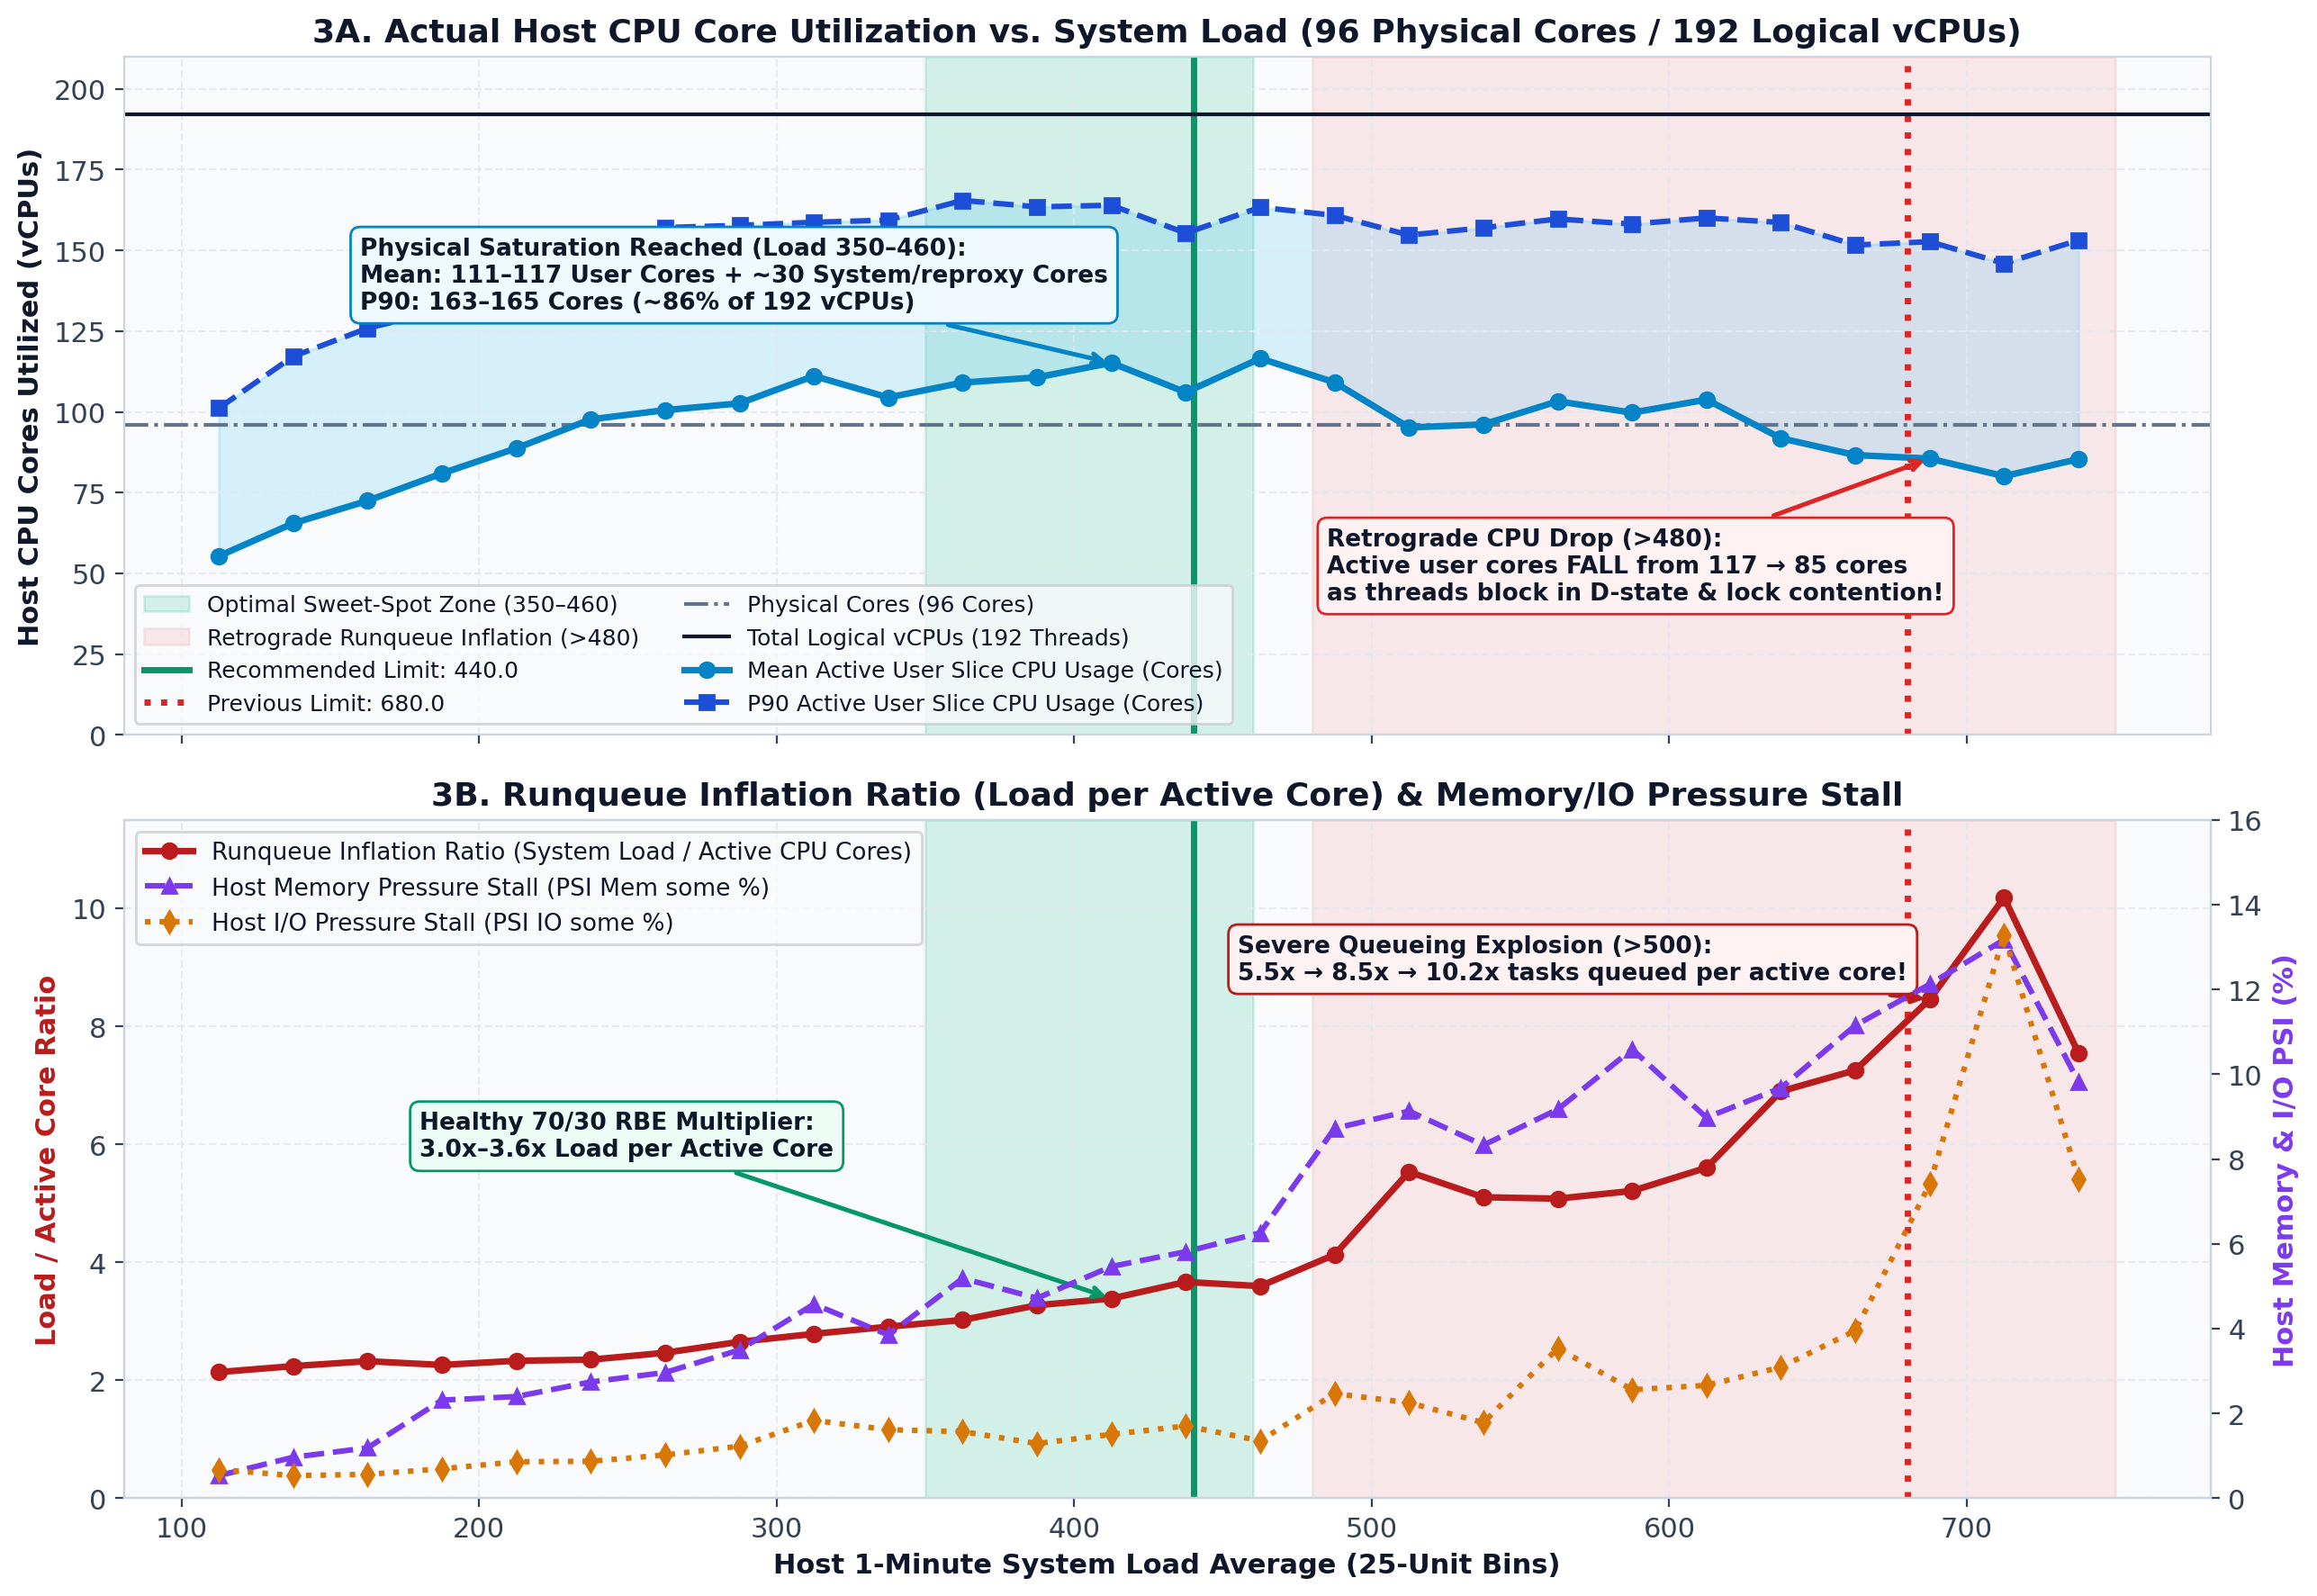
Figure 4: End-to-End Clean Full-Build Duration & Unexpected Termination Rate
Across 232 completed full AOSP builds (≥120k actions) and 668 large build launches: builds below P75 load 480 finish in ~45 min median (0%–5.4% abort rate), whereas builds in the 650+ regime drag to 85.1 min median (119.9 min P90) with a 36.3% unexpected stop rate.
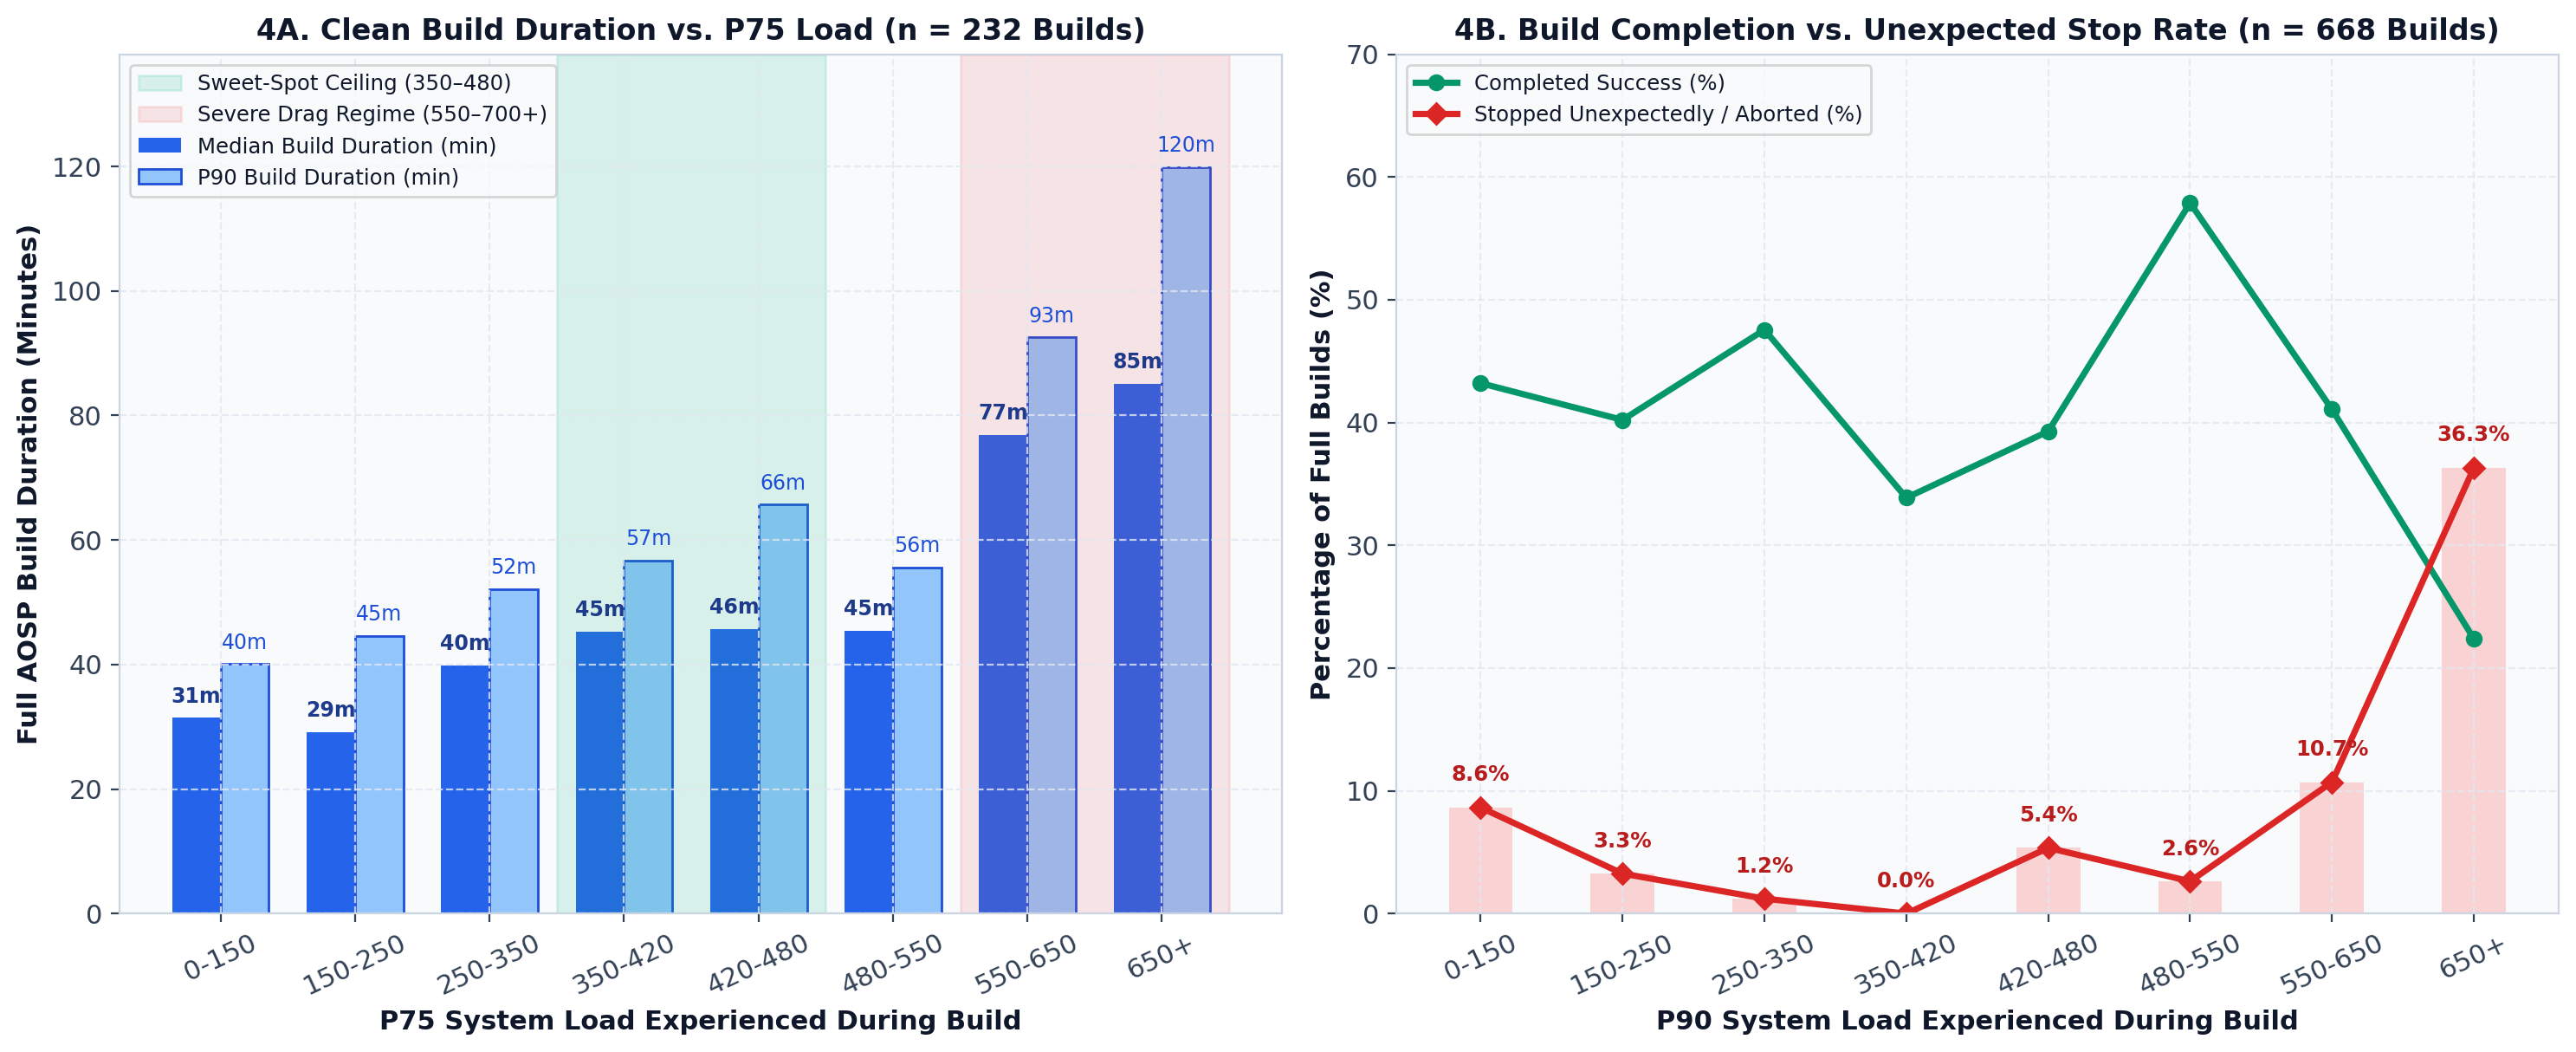
Figure 5: Concurrency-Controlled Host Throughput (2, 3, 4, 5, and 6+ Simultaneous Compiling Builds)
Controlling for exact build concurrency confirms that the 460–480 cliff is not a workload-mix artifact: for every concurrency level from 2 to 6+ builds, aggregate server output peaks inside 250–450 and degrades above 480.
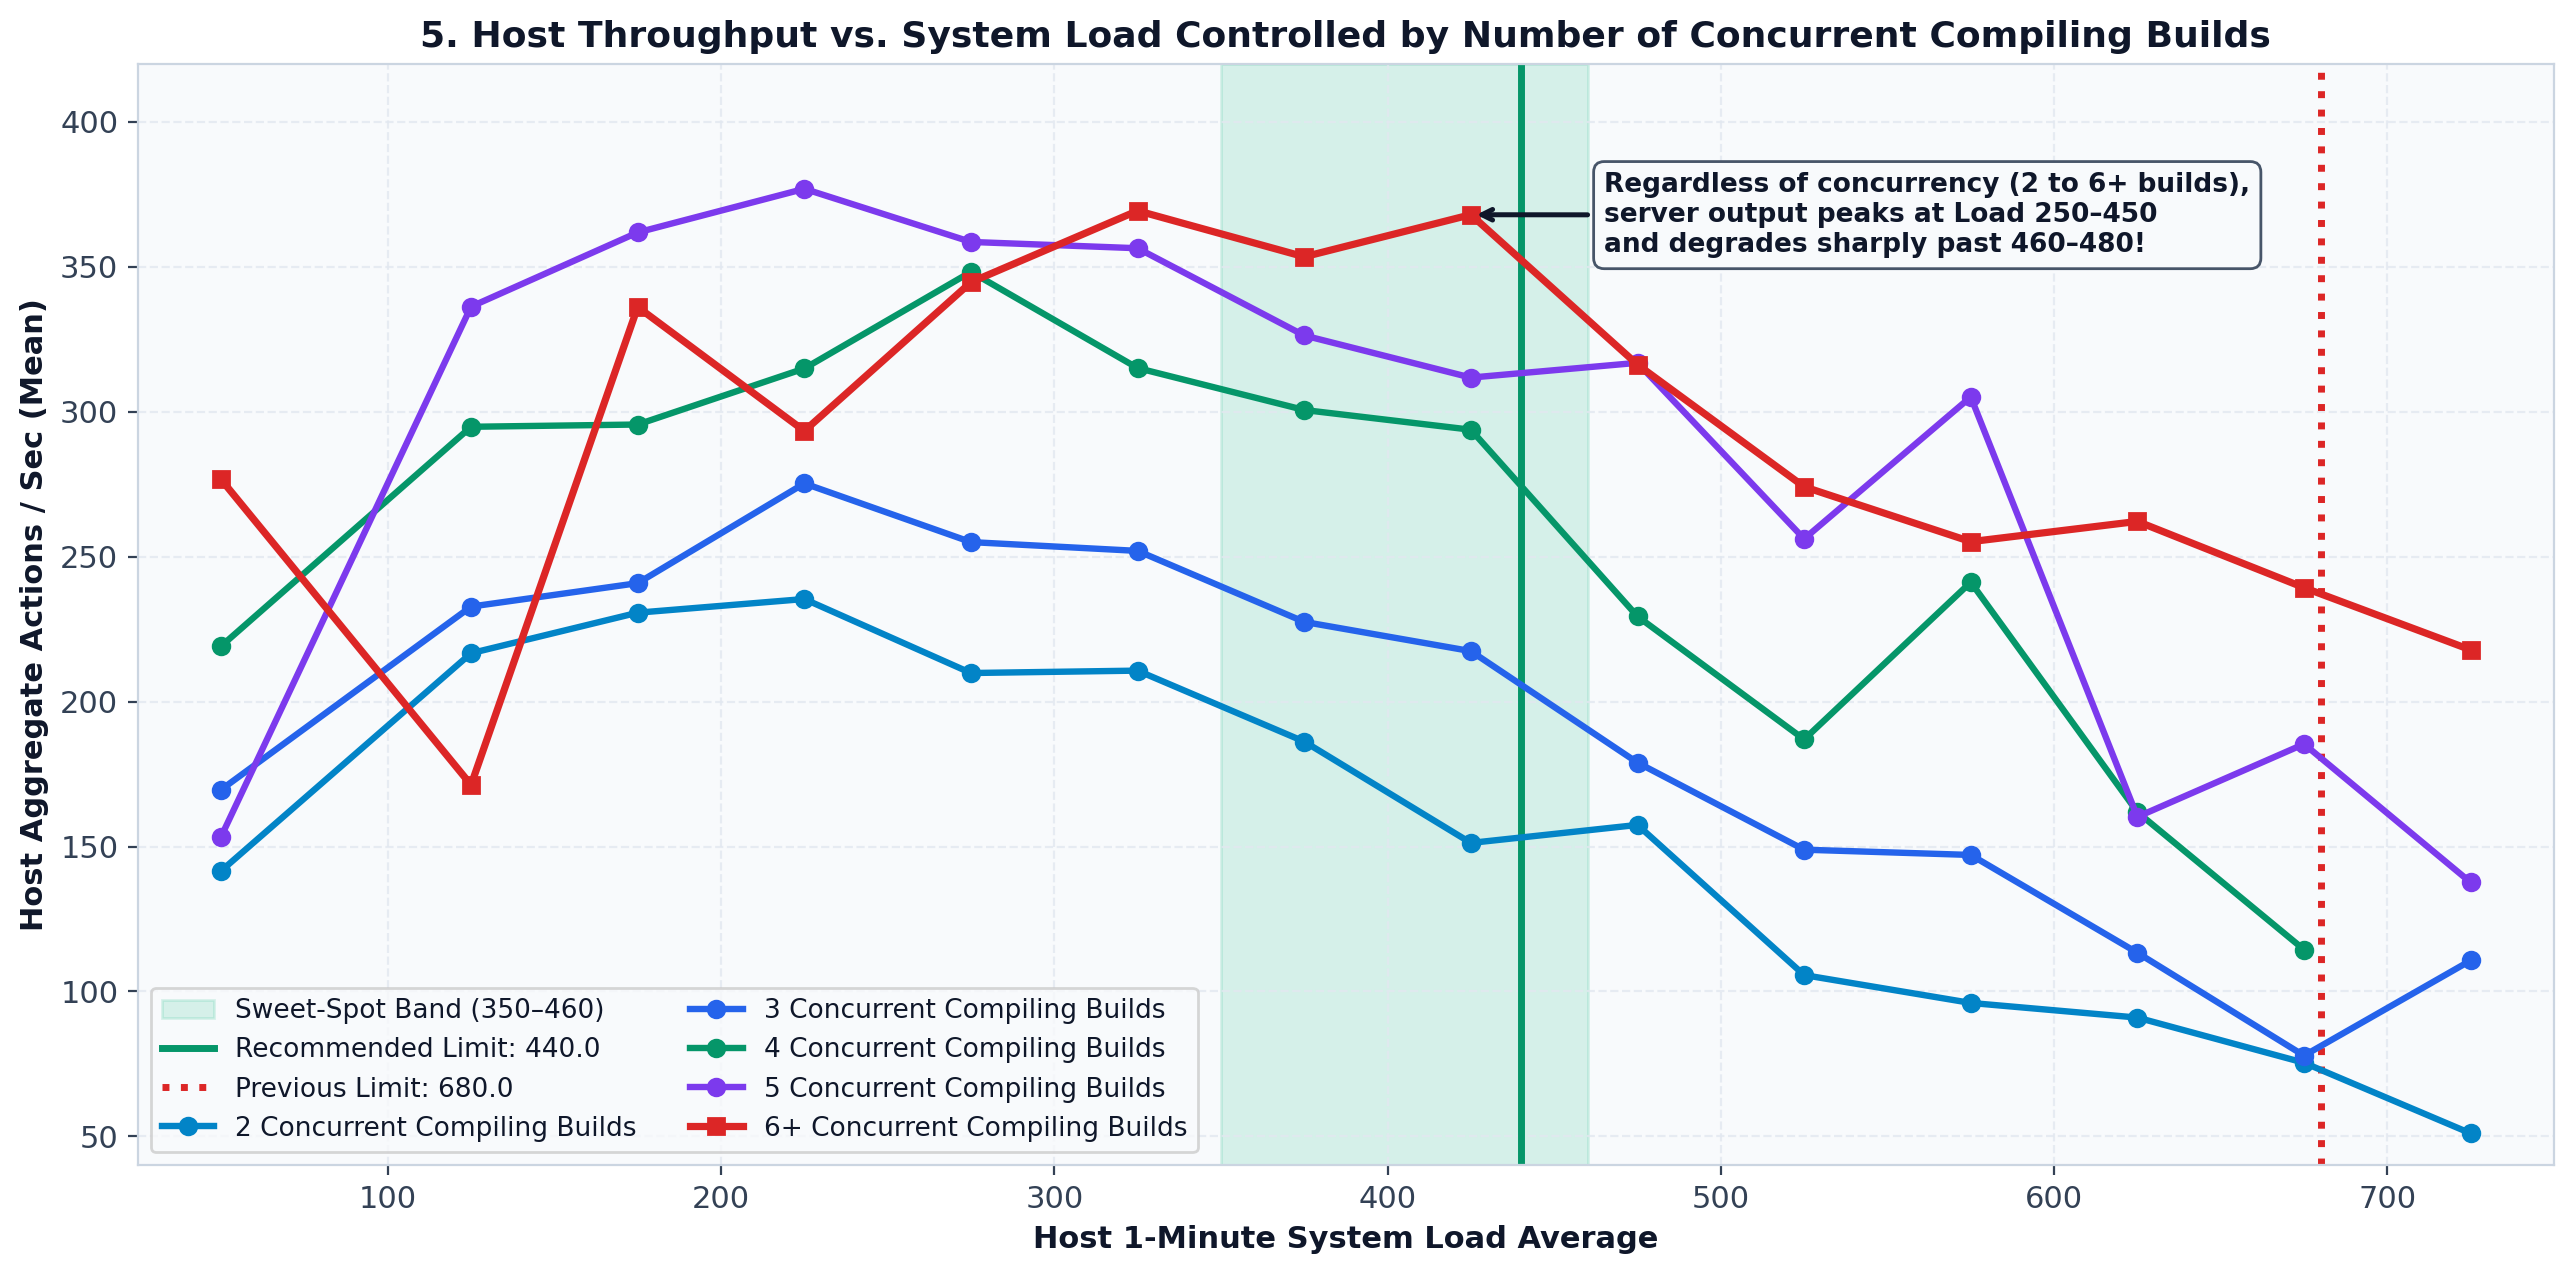
Figure 6: In-Flight Remote RBE vs. Local Actions & Tiered Load Limit Architecture
Left: Empirical split between concurrent remote RBE actions and local jobs. Right: Comparison of previous load limits (550–700, all above the thrashing cliff) against recommended sweet-spot ceilings (360–460).
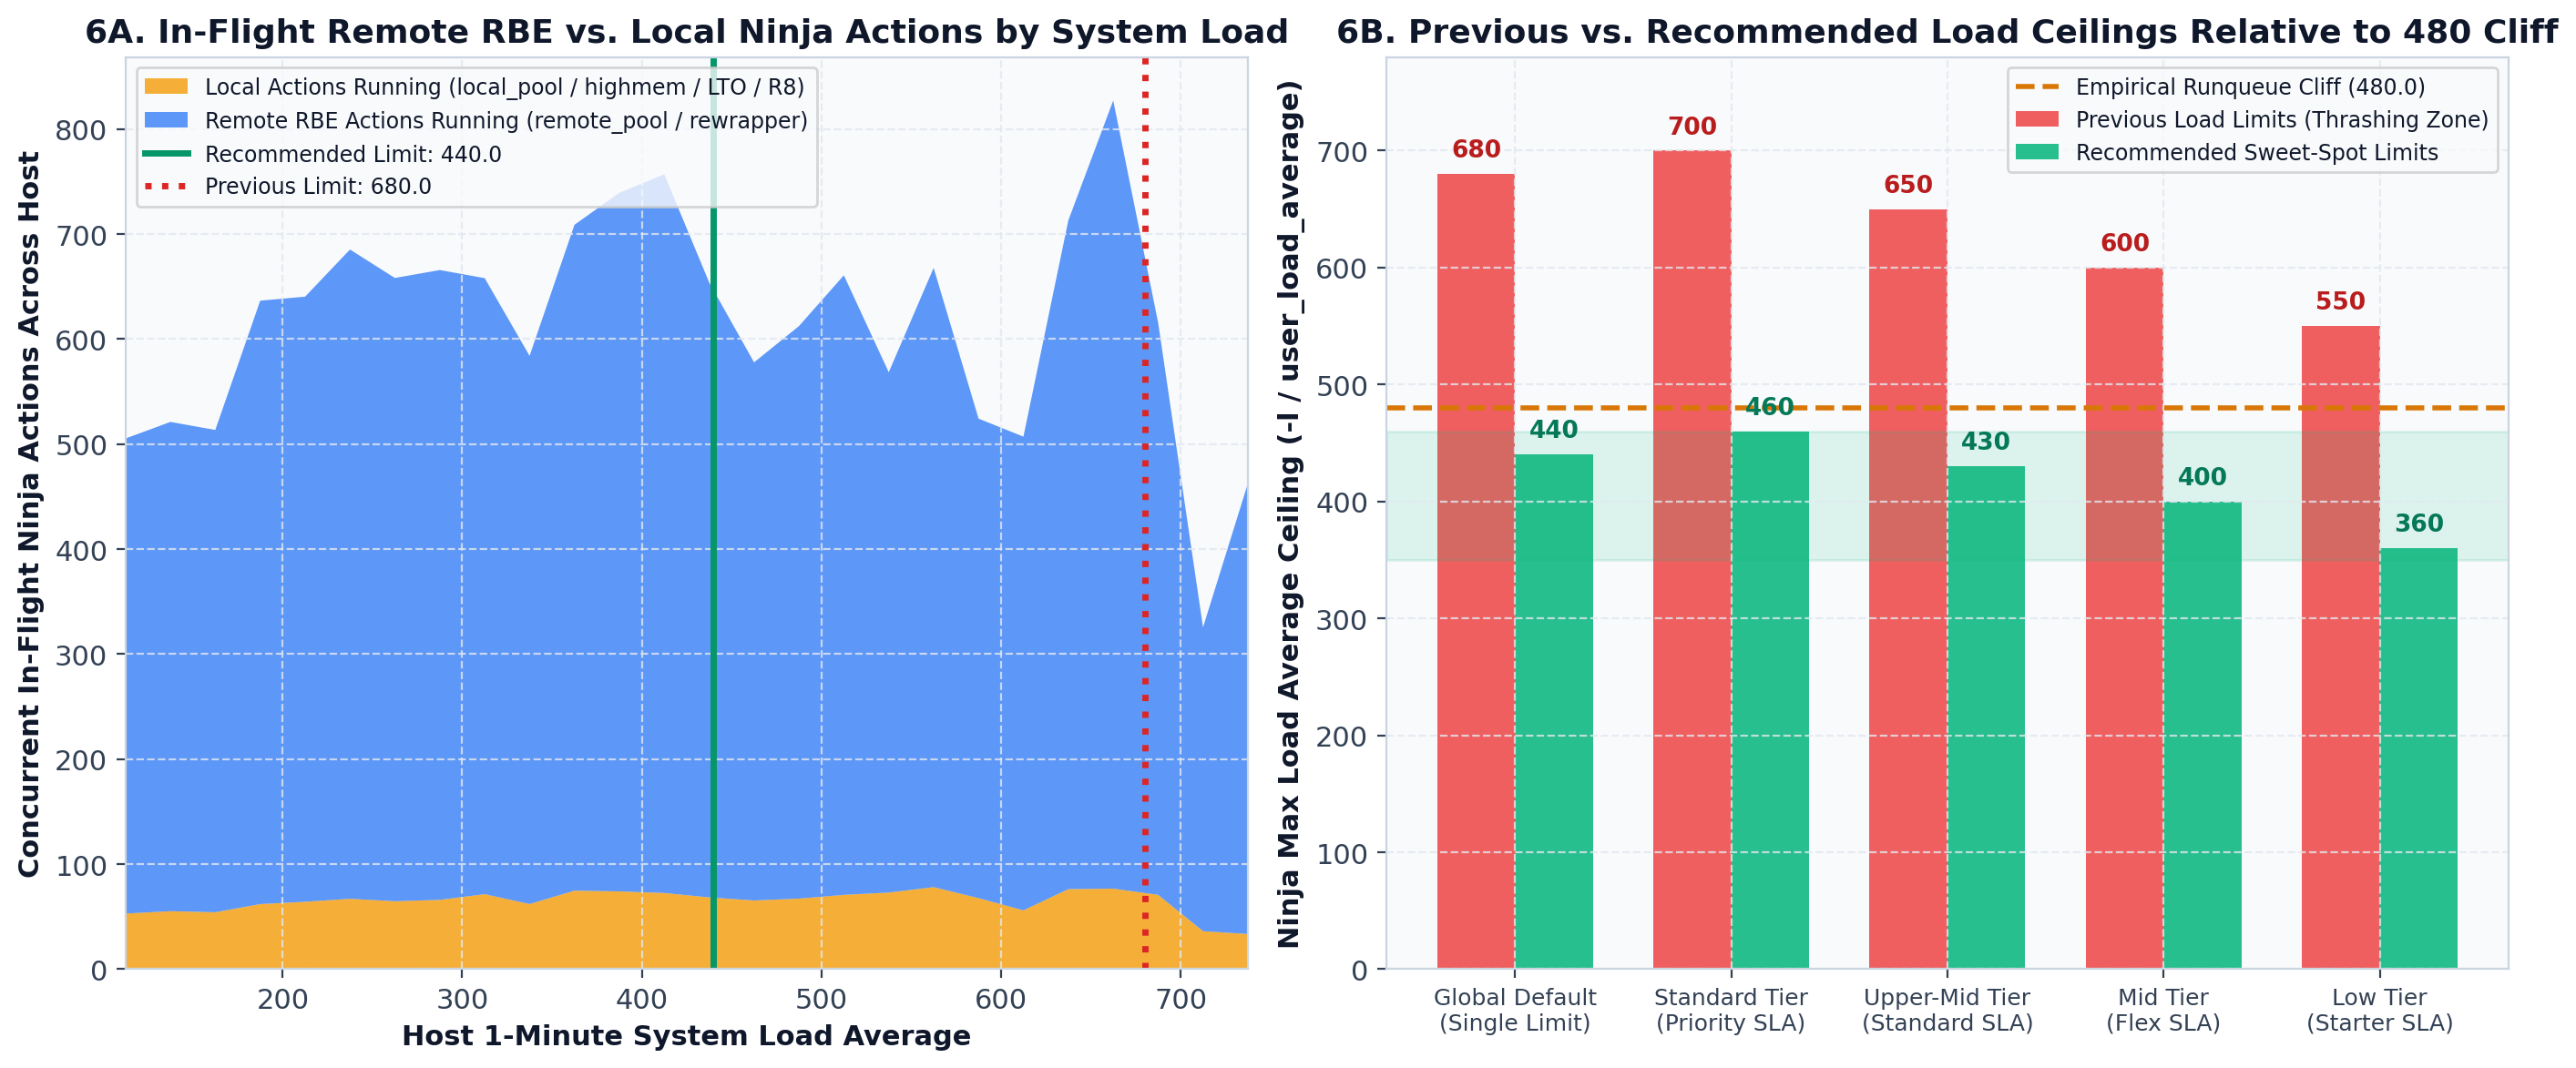
Figure 7: Architectural Anatomy of /opt/ninja Load-Gating Under 70% RBE / 30% Local Builds
End-to-end control flow showing how Redis dynamic limits, /opt/ninja Plan::FindWork(), and Linux kernel runqueues interact—allowing 70% remote RBE edges to bypass the load gate at 440.0 while deferring local pool launches before the 480 cliff.
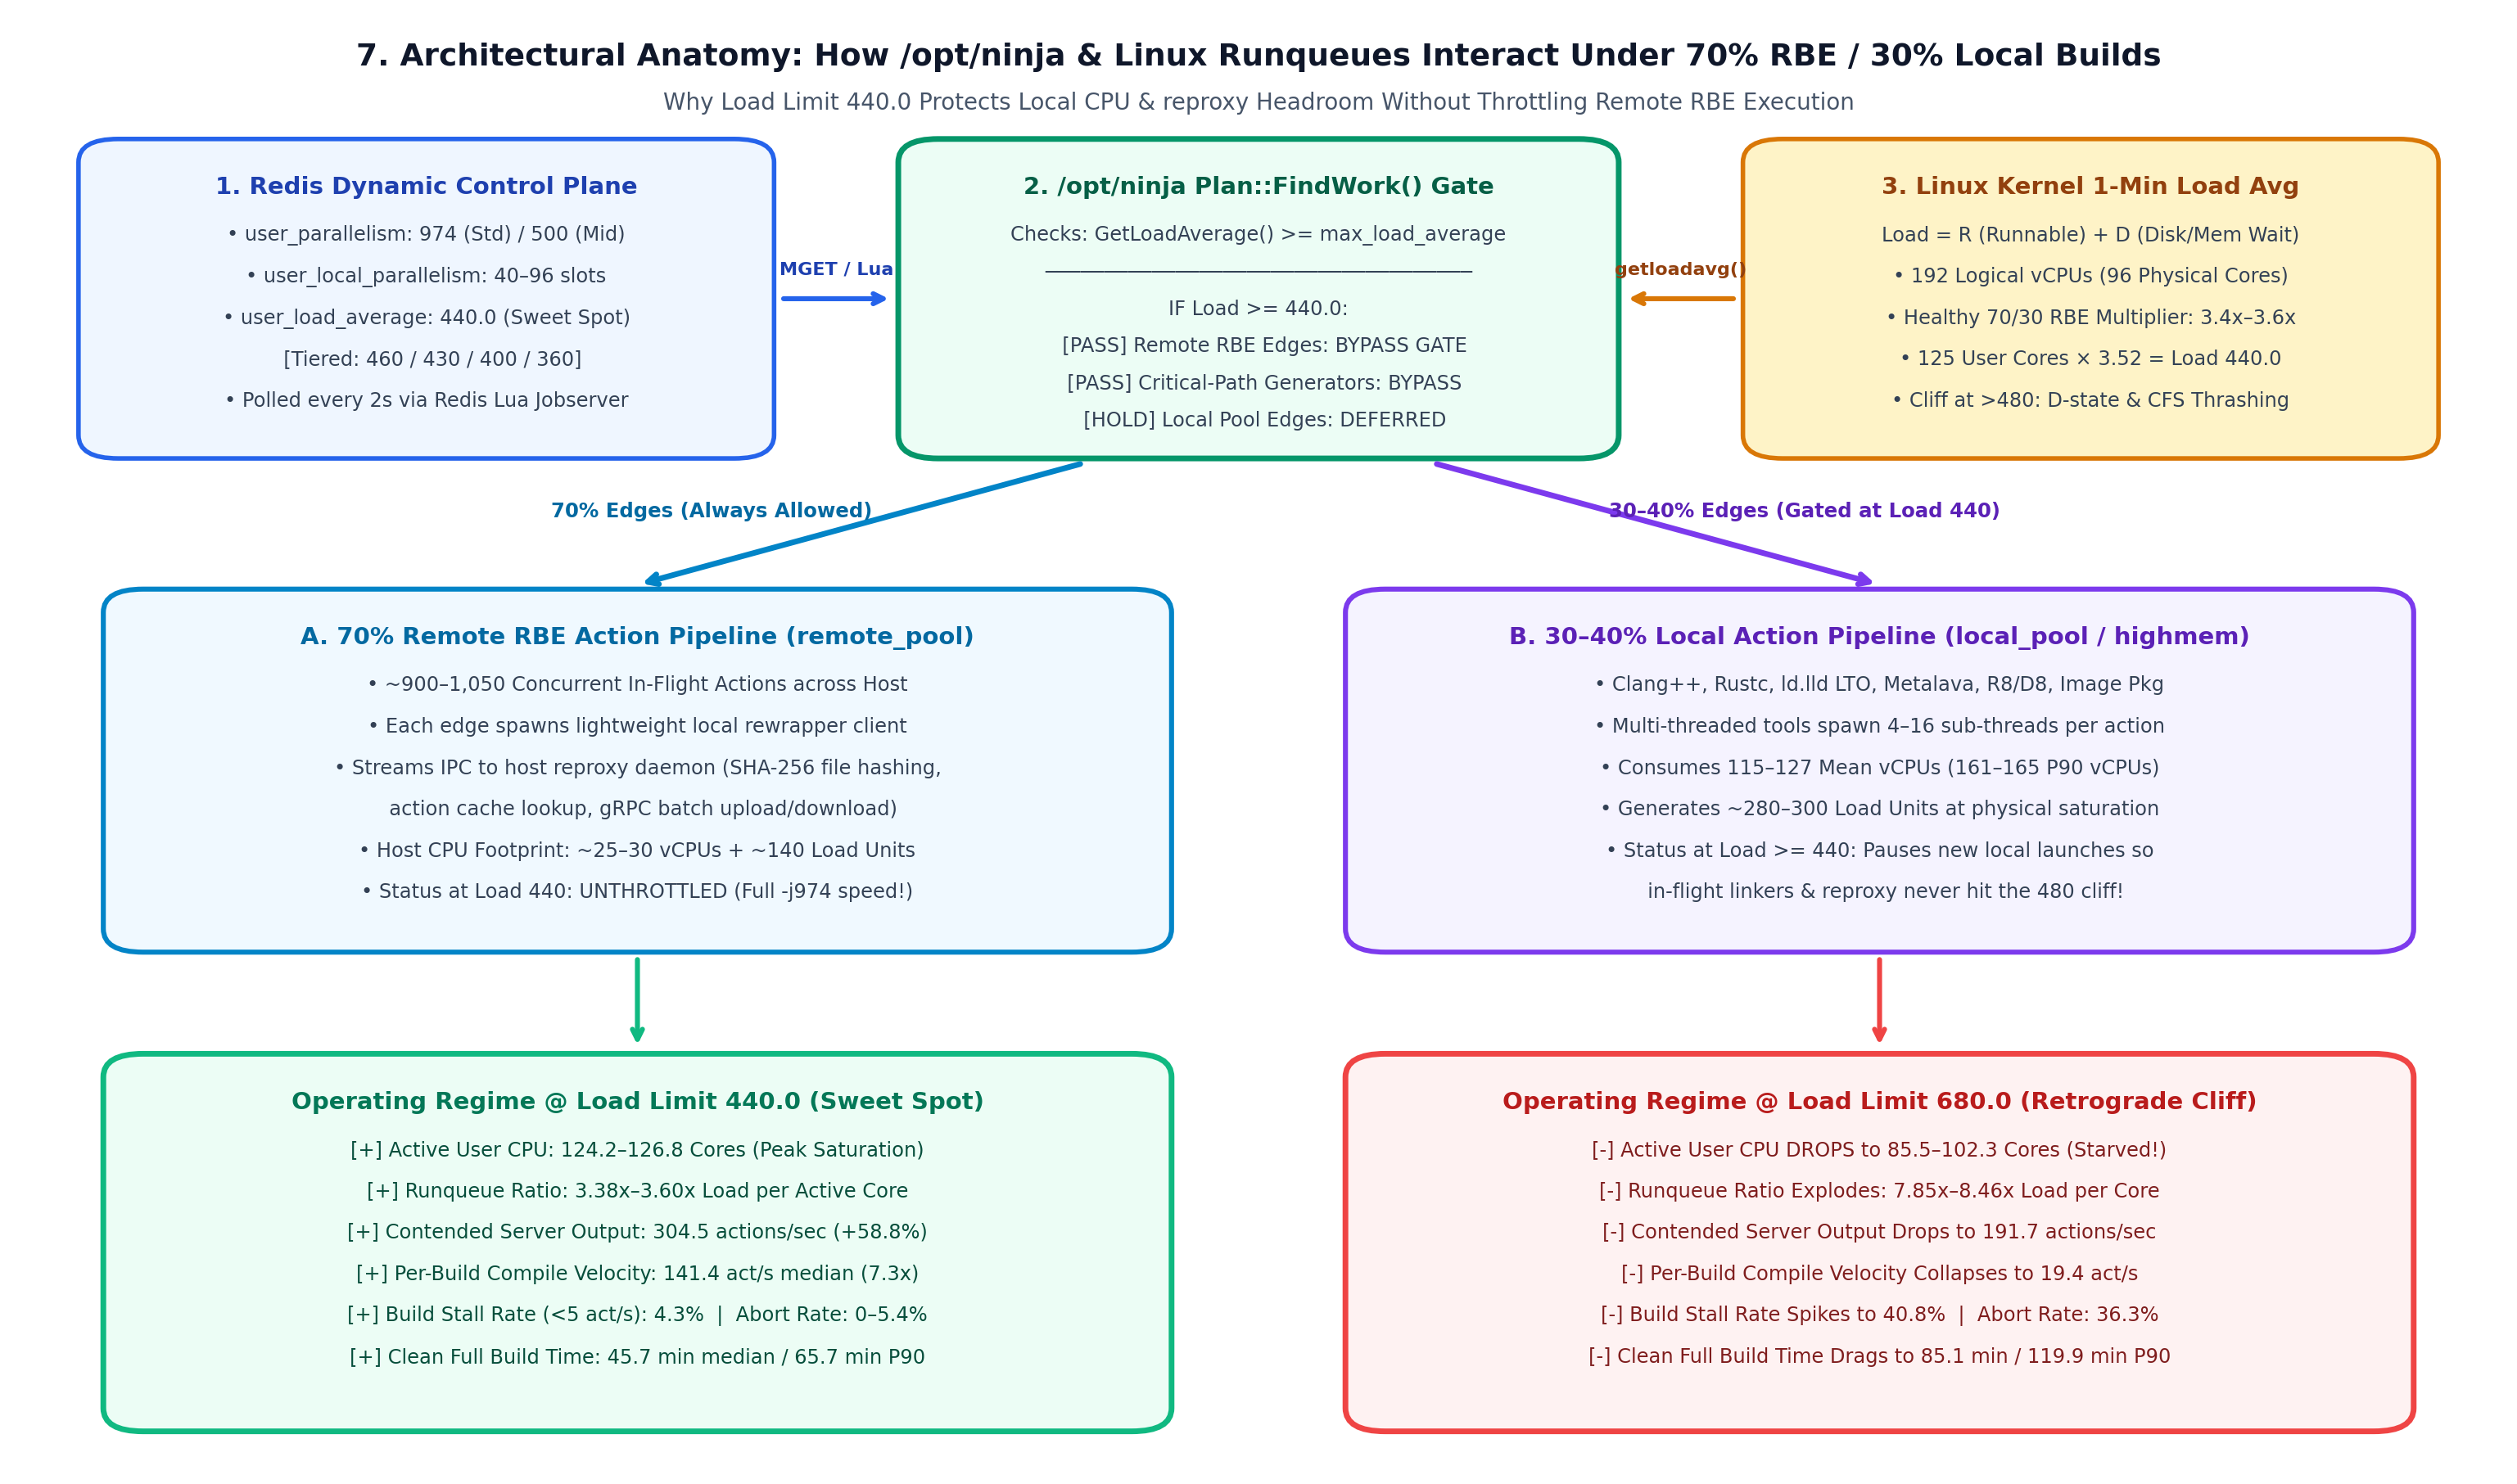
Figure 8: 2D Joint Density Heatmap (Build Progress Phase % vs. System Load)
Left: Median build velocity (actions/sec) across 8 progress stages and 9 system load bands. Right: Build stall probability (% < 5 act/s) across the same 2D phase × load grid.
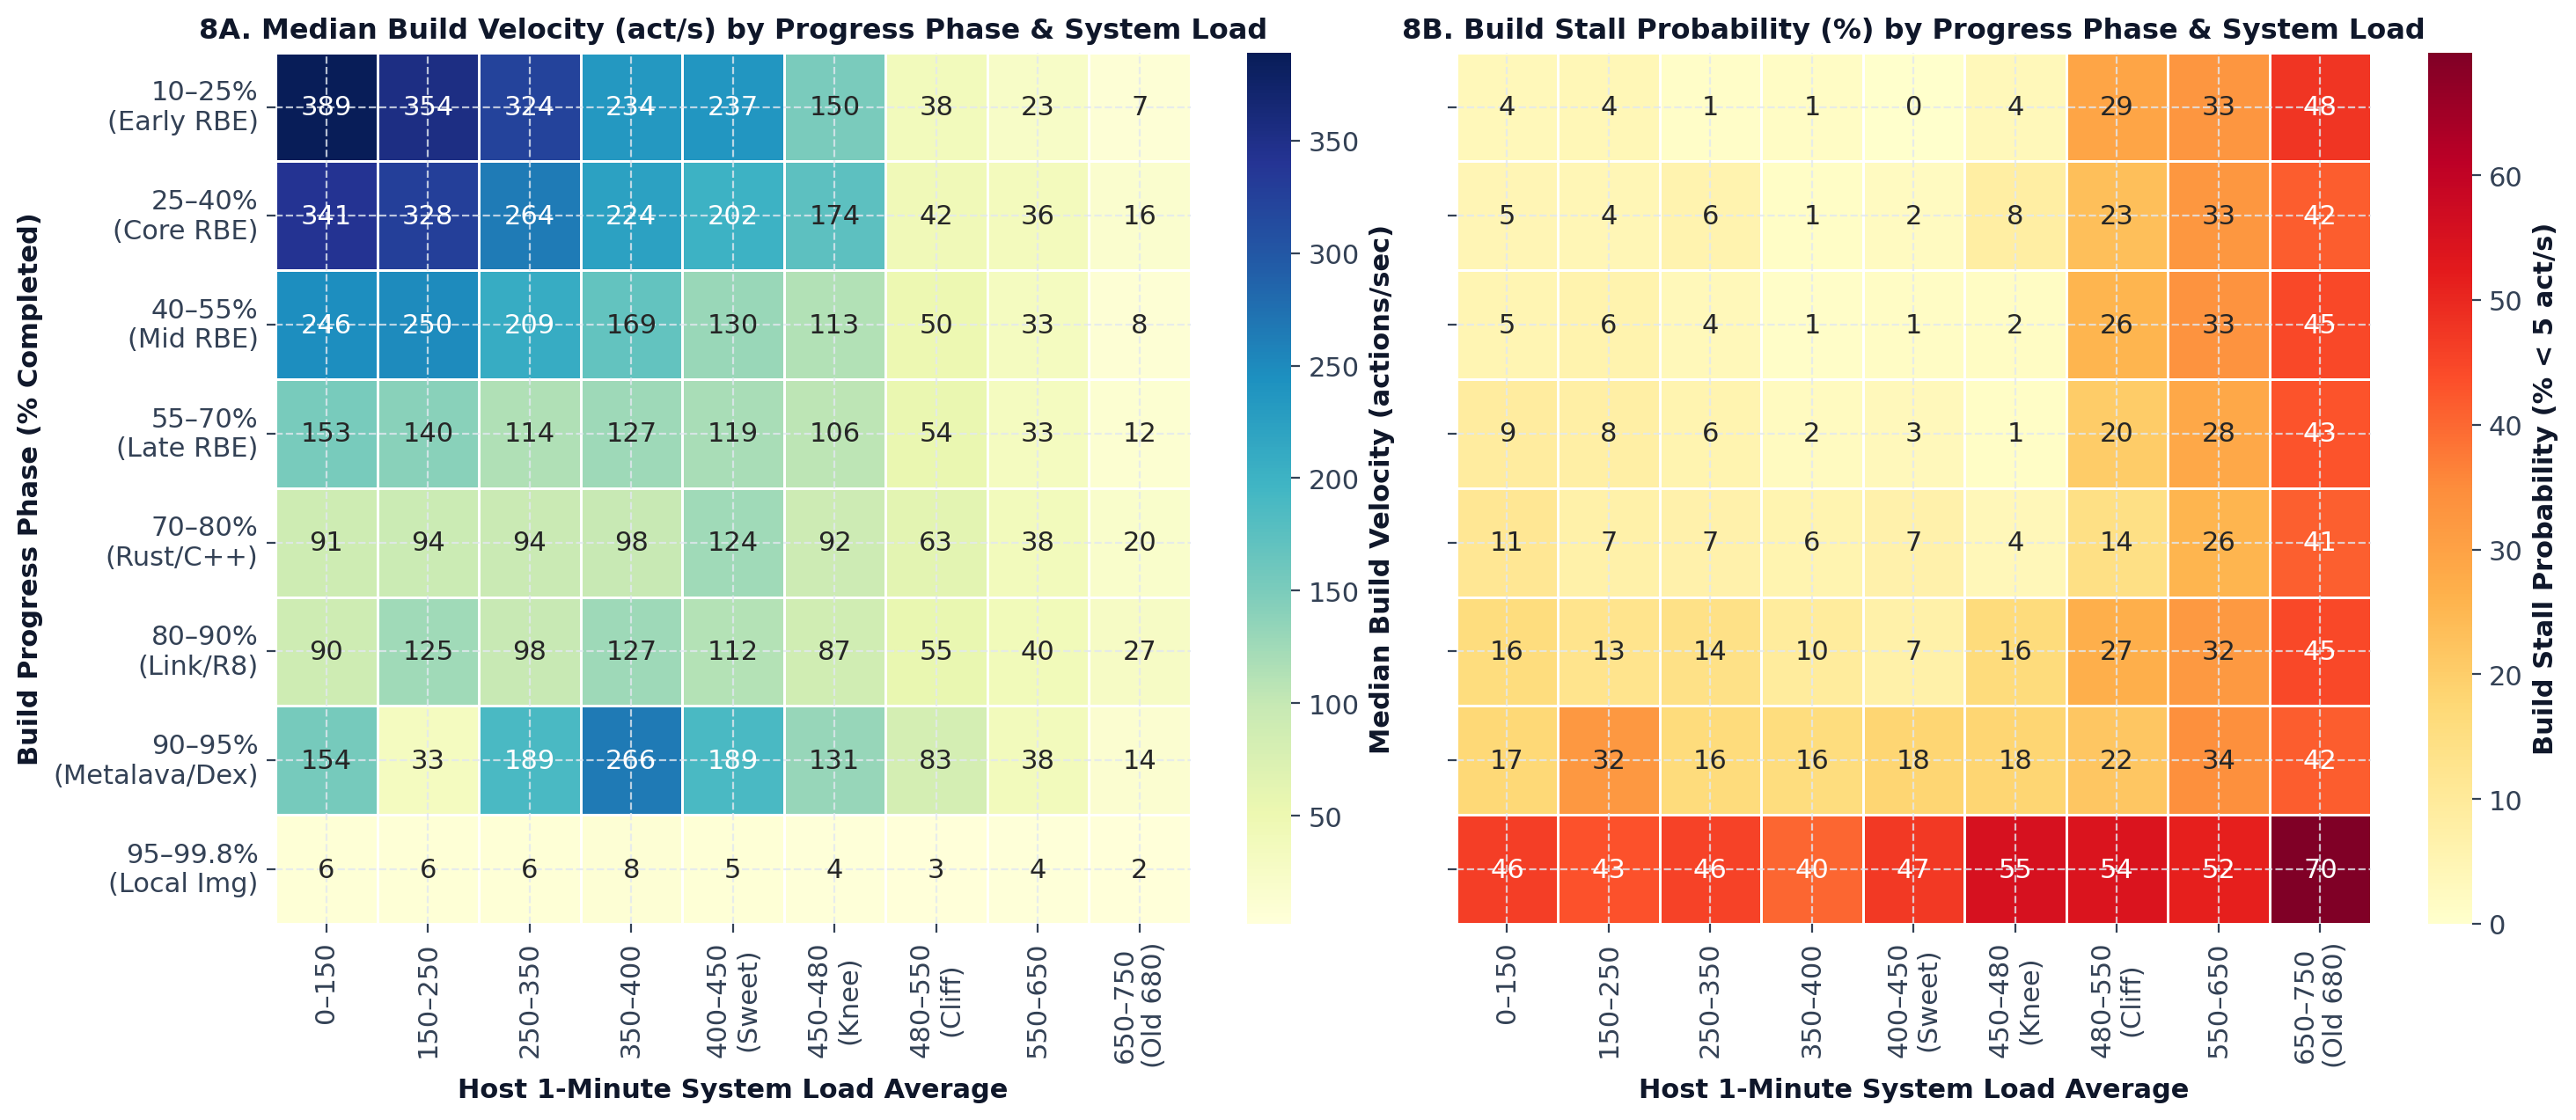
Figure 9: Full Probability Distributions (Violin & Boxplots) Across 6 Operating Regimes
Shows the full quartile and density distribution of per-build compile speed (left) and contended host aggregate output (right) from Light (<200) through Sweet Spot (350–450) to Old 680 Zone (580–750+).
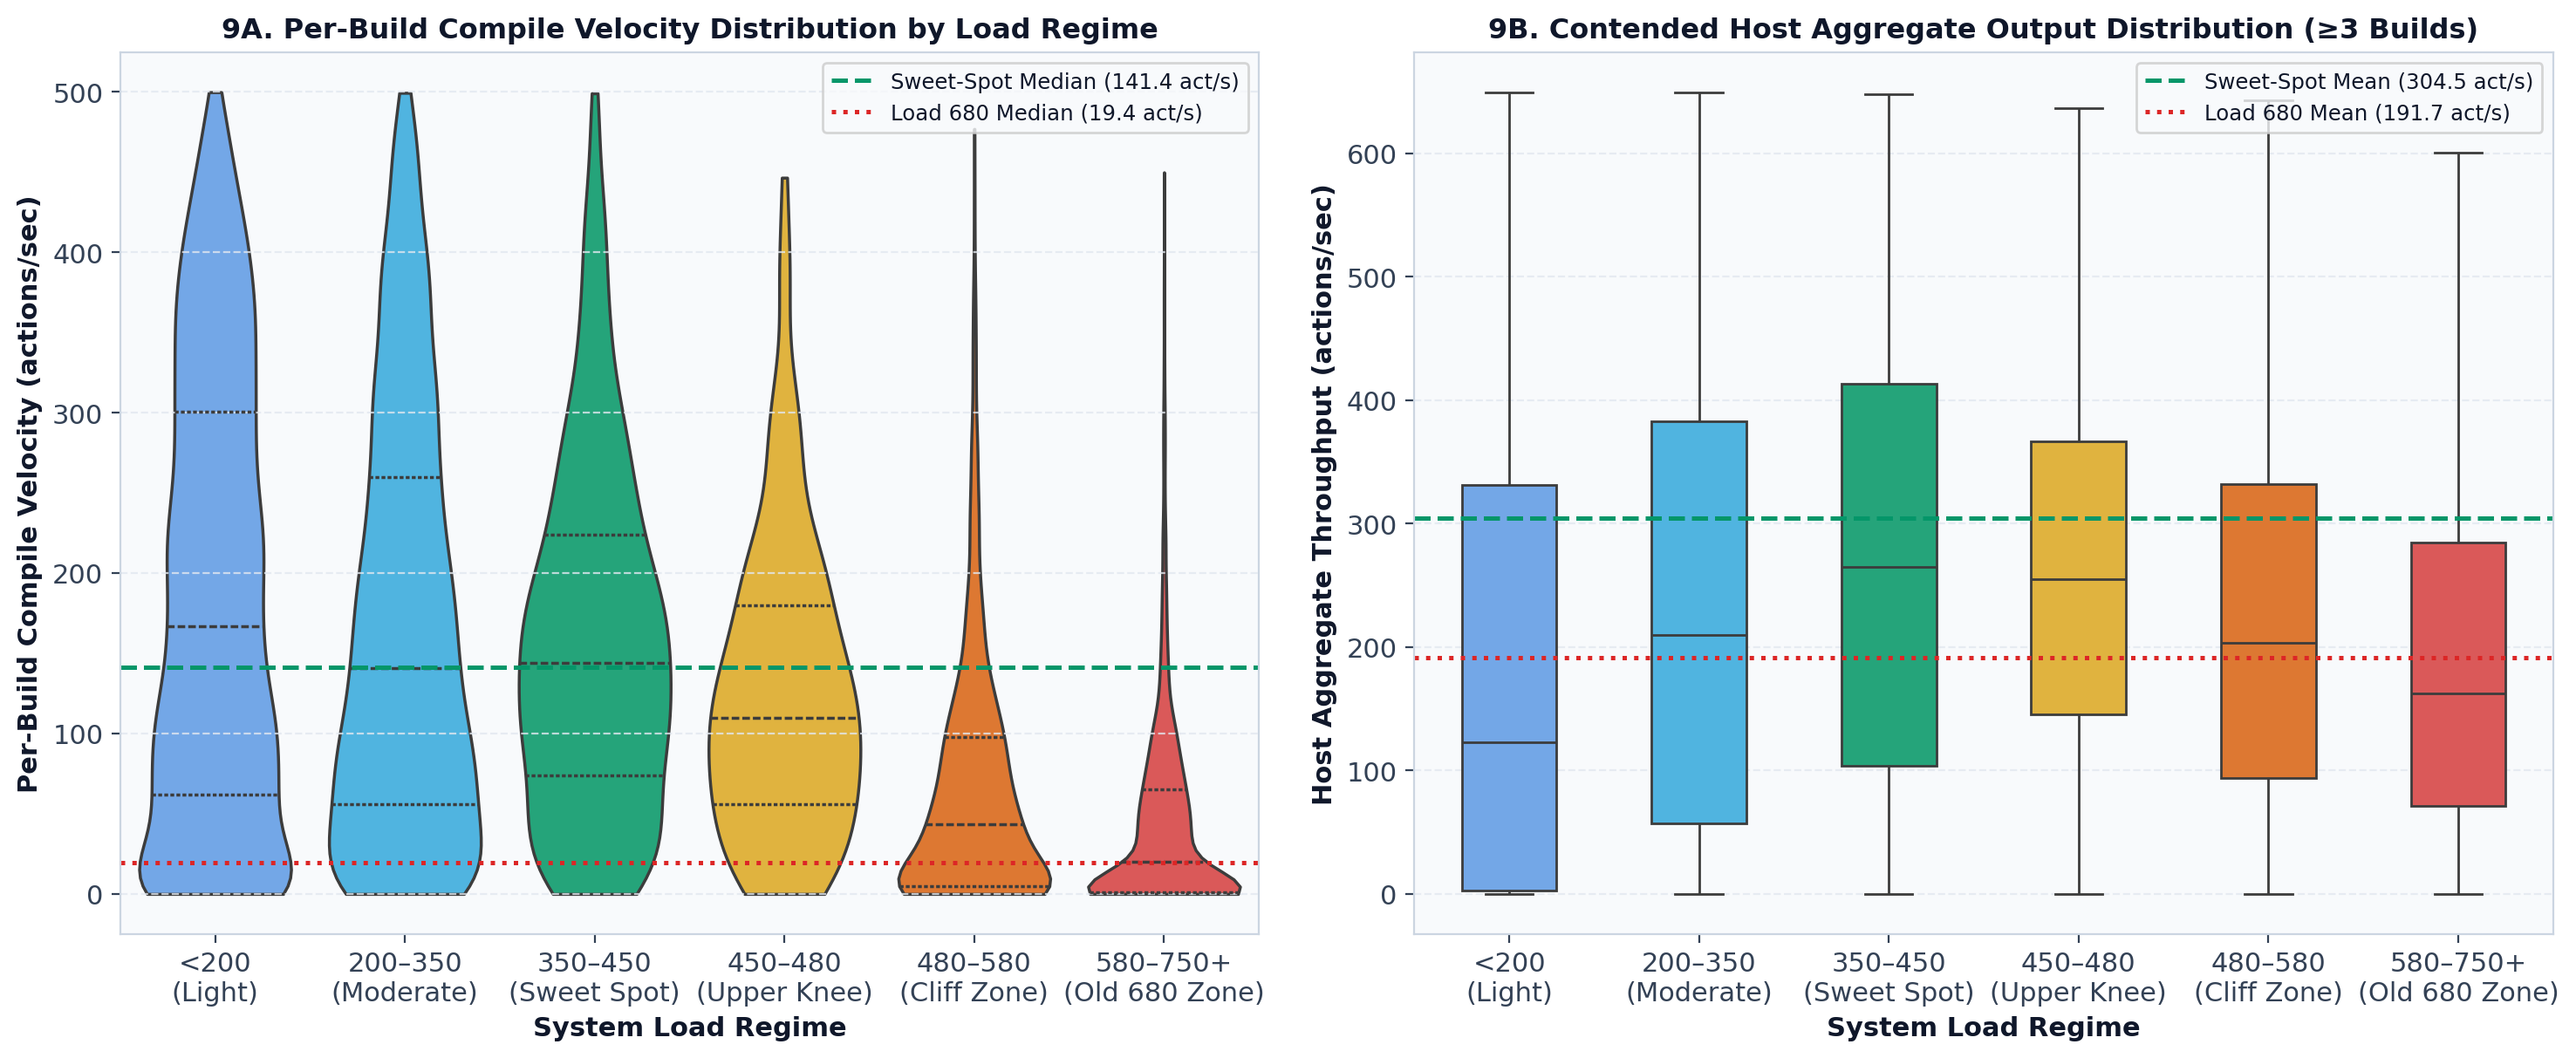
Figure 10: Real Tracked AOSP Build Trajectories (Smooth Sailing @ Load ≤ 440 vs. Thrashing @ Load ~ 680)
Side-by-side comparison of two 225,000-action AOSP builds from live_build_tracing.db: a build under the 440 regime finishes its main Ninja graph in 38.8 minutes with zero stalls, whereas a build exposed to load 600–720 drags for 67.9 minutes.
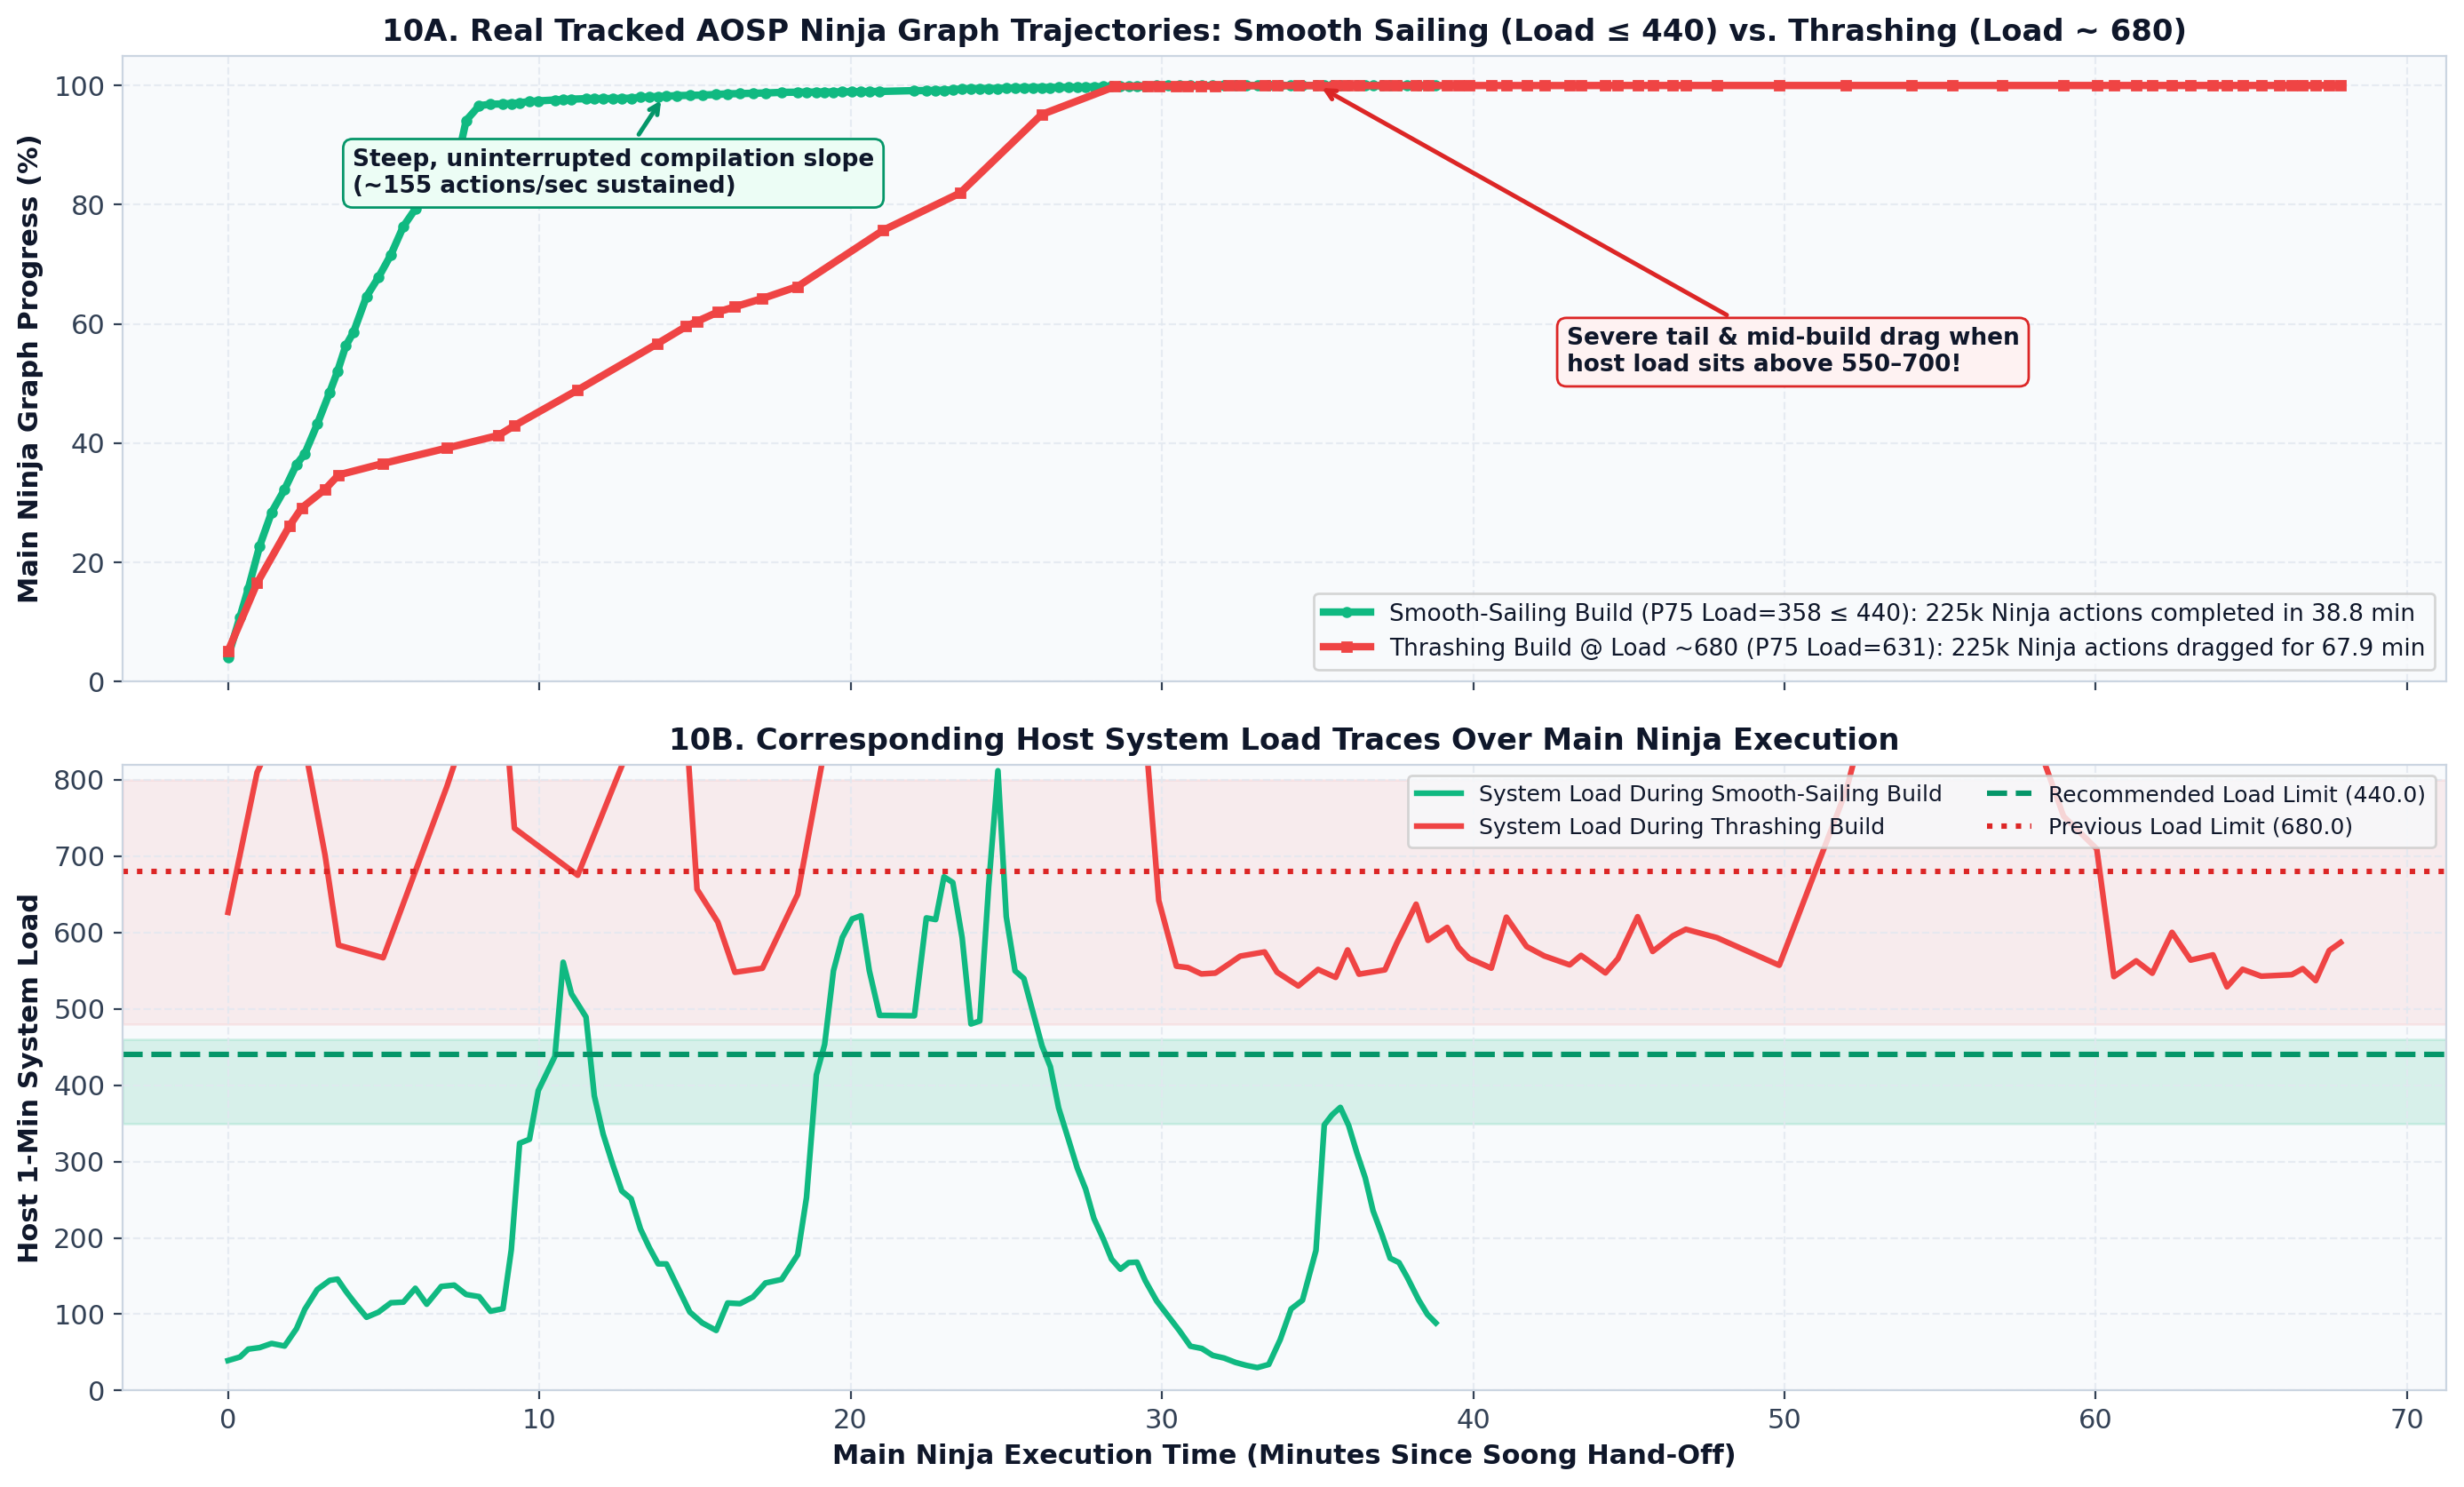
Figure 11: 6-Dimensional Radar Profile & Pareto Efficiency Frontier
Left: Normalized 6-axis radar comparison of Load 440, 350, 550, and 680. Right: Pareto Efficiency Frontier mapping Contended Host Output (X) vs. Per-Build Speed (Y), sized by Active CPU Cores and colored by System Load.
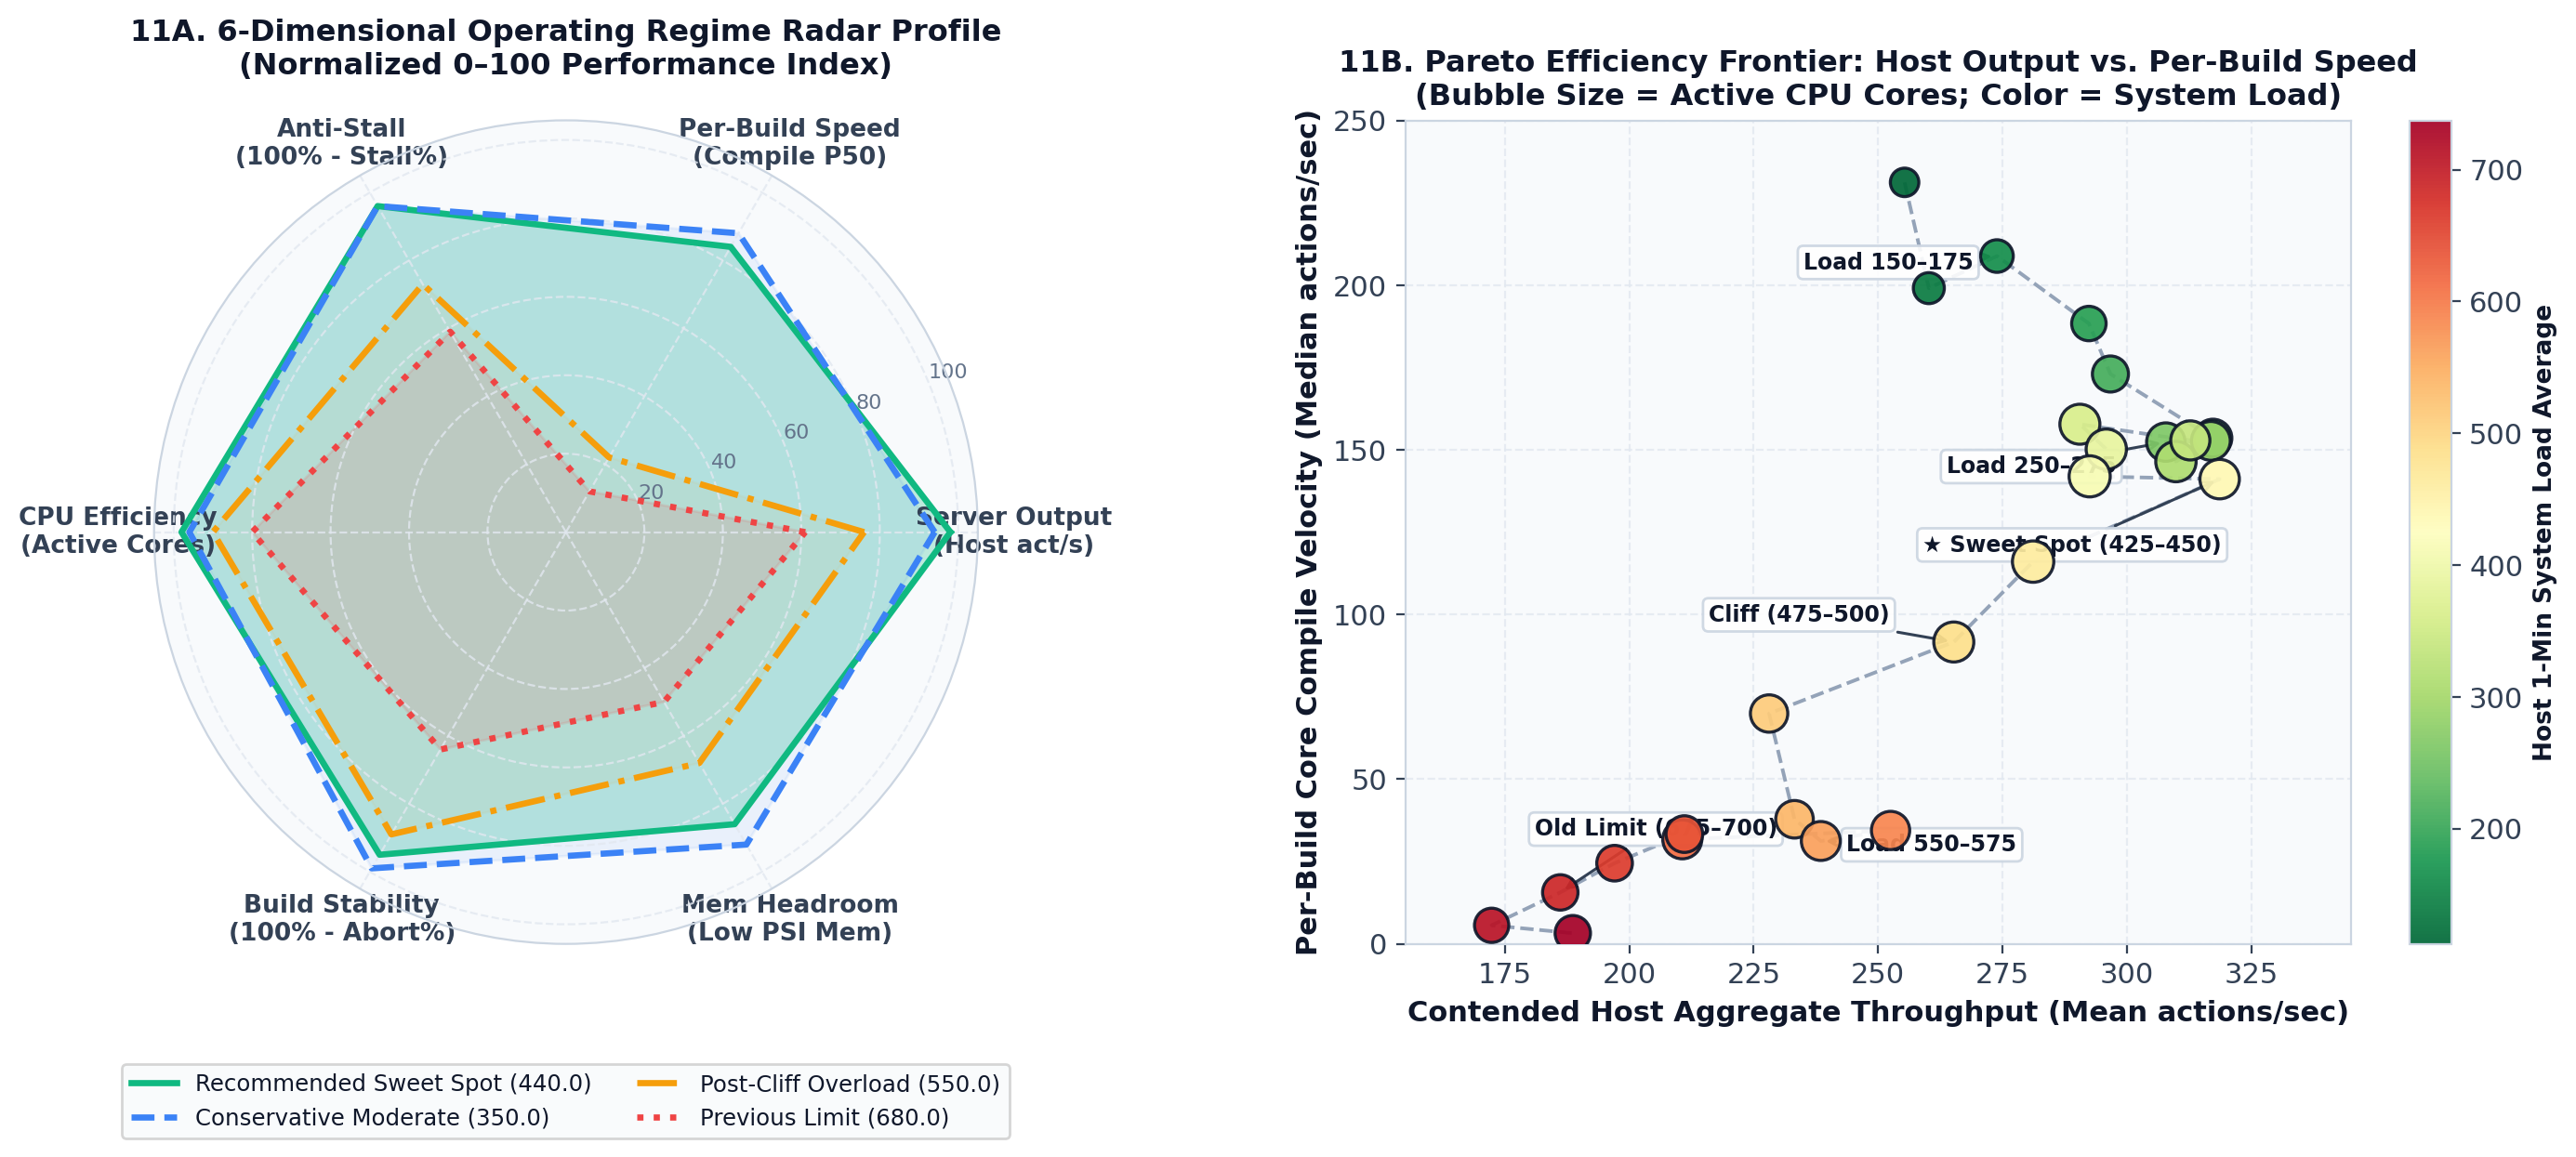
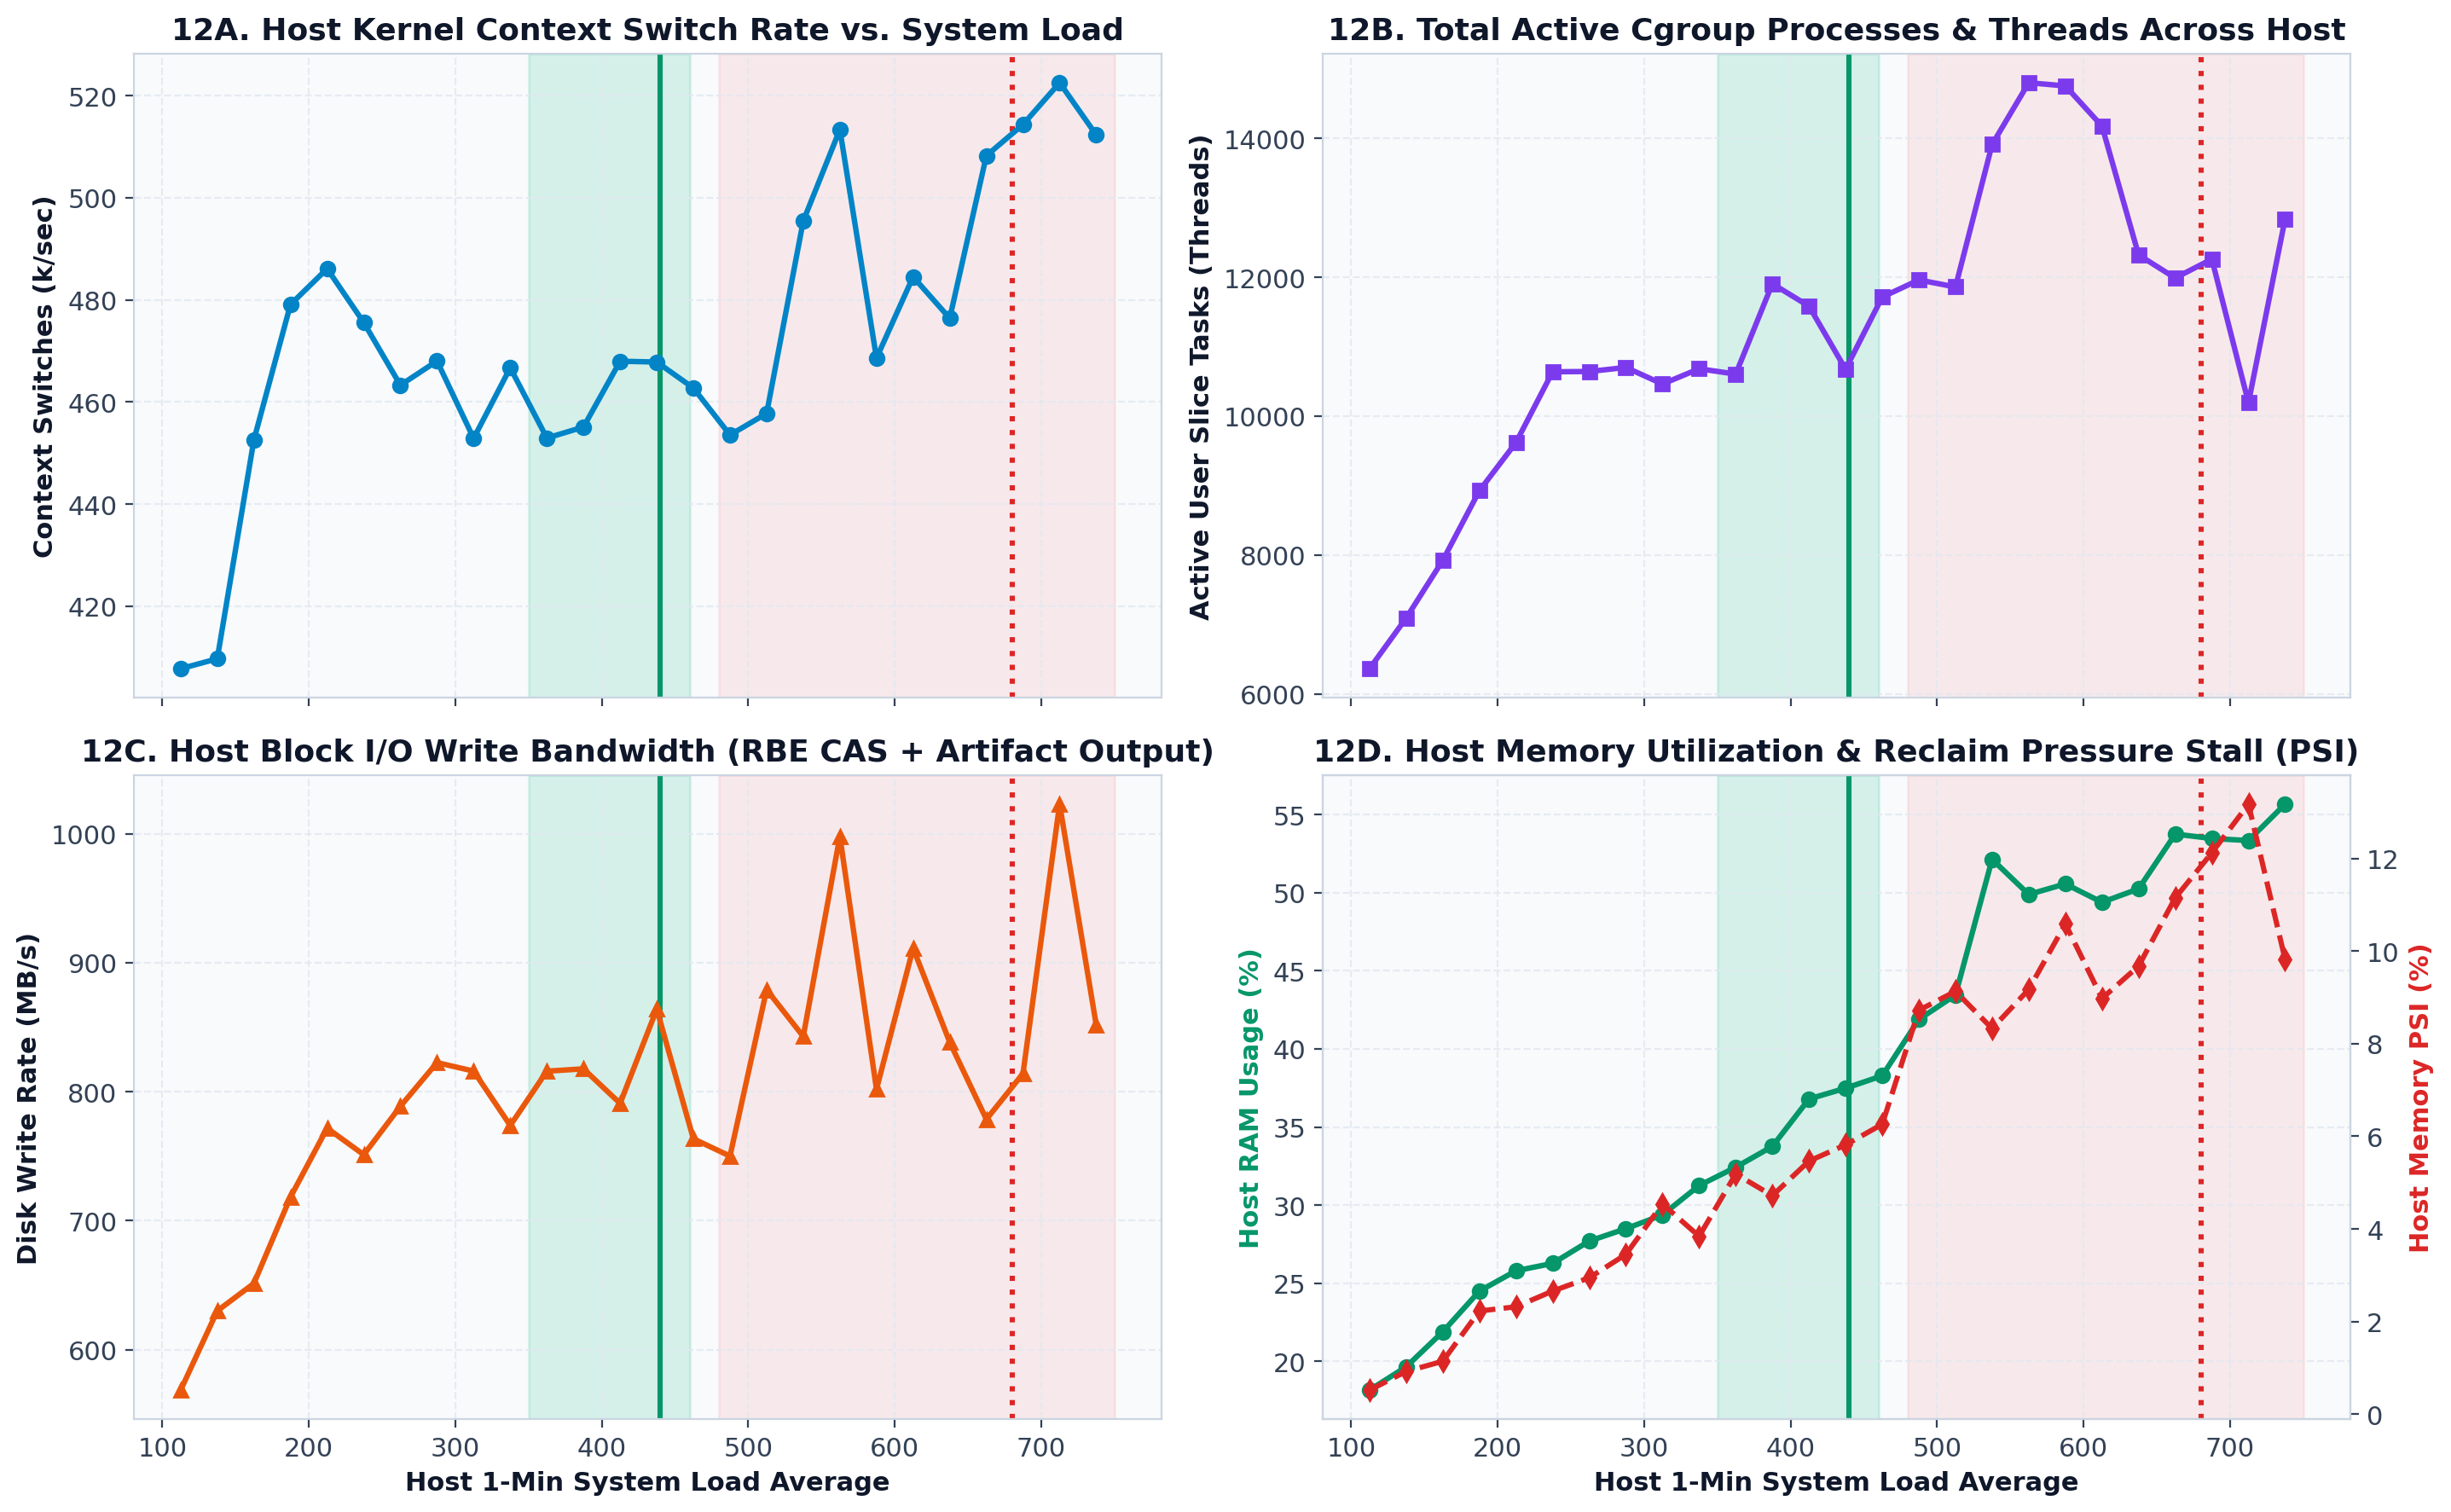
Figure 12: 4-Panel Subsystem Contention Anatomy (Context Switches, Cgroup Tasks, Disk Write MB/s, Memory PSI)
Tracks host kernel context switches/sec, active cgroup processes/threads (14,000+ above load 525), disk write bandwidth (MB/s), and host RAM utilization vs. Memory PSI across 25-unit load bins.
📊 Complete 25-Unit Granular Telemetry Dataset (Load 100 to 750)
| Load Band | 8s Windows | Contended Host Mean (act/s) | Contended Host P50 (act/s) | Per-Build Compile Mean (act/s) | Per-Build Compile P50 (act/s) | Stall Rate (<5 act/s) | Crawl Rate (<25 act/s) | Active User Cores | Load / Core Ratio | Host CPU PSI | Host Mem PSI |
|---|